

Weekly summary 08/06
Weekly summary 08/06
LWS Financial Research - new horizons

Disclaimer
LWS Financial Research is NOT a financial advisory service, nor is its author qualified to offer such services.
All content on this website and publications, as well as all communications from the author, are for educational and entertainment purposes only and under no circumstances, express or implied, should be considered financial, legal, or any other type of advice. Each individual should carry out their own analysis and make their own investment decisions.
Since our merger with Locos de Wall Street, the service's name changed from Kairoscap to LWS Financial Research, and until now, it seemed more like an arbitrary change than anything else, but that is going to change starting today. As we have been announcing for several months, we have been working on bringing a dashboard of key metrics and actionable market opportunities to facilitate investment decision-making. Since yesterday, when we sent the first version on Discord, paid subscribers will receive a weekly presentation with the following sections:
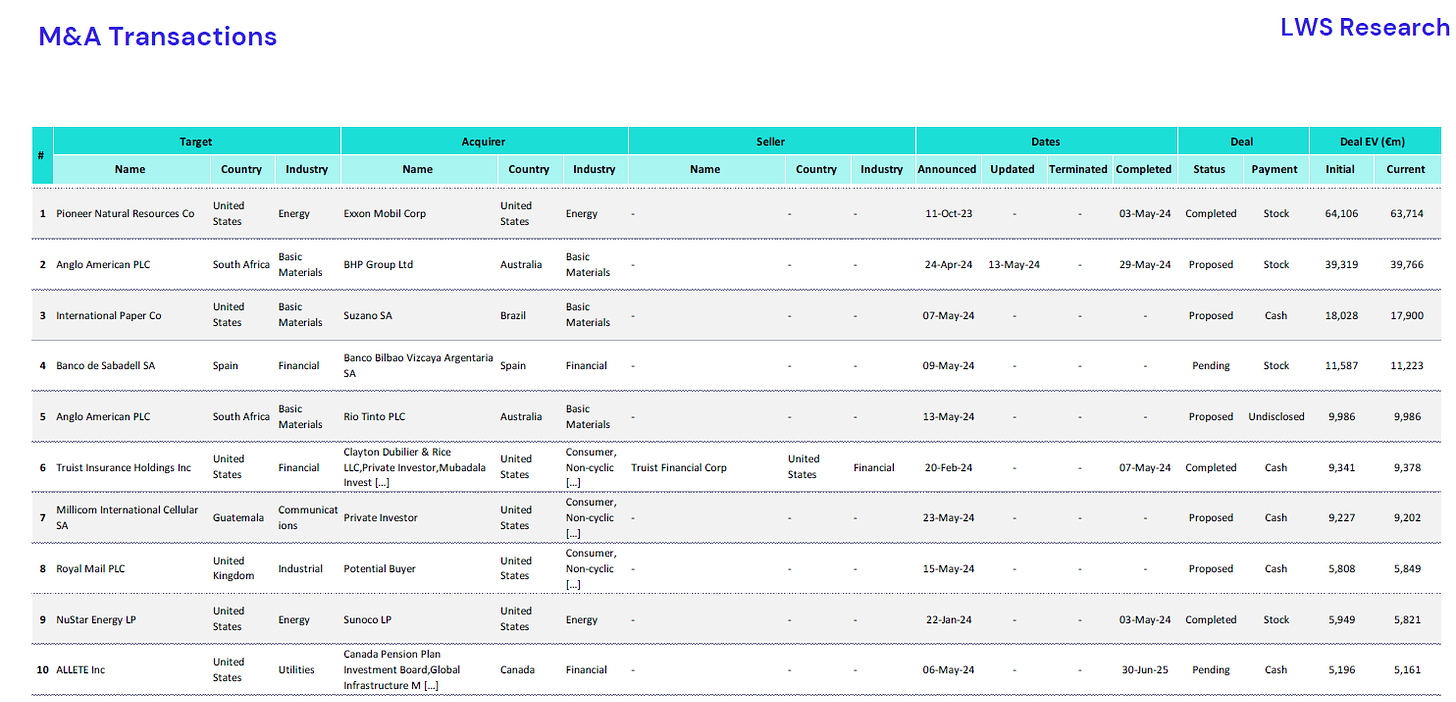
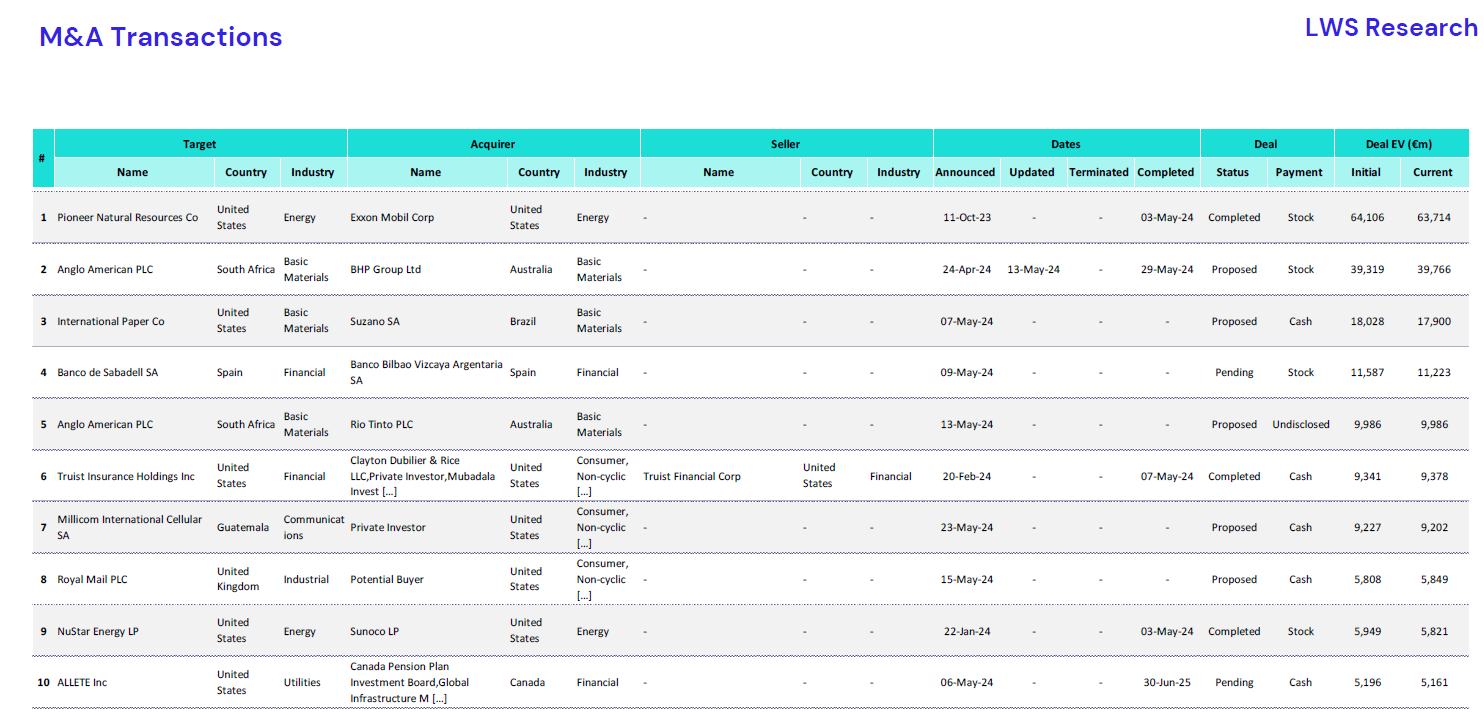
Corporate Operations Panel: Corporate operations are often special situations where a lot of value is created if leveraged correctly. We will have a panel with all M&A transactions, tender offers, spin-offs, JVs, and the most notable spreads and opportunities derived from them.
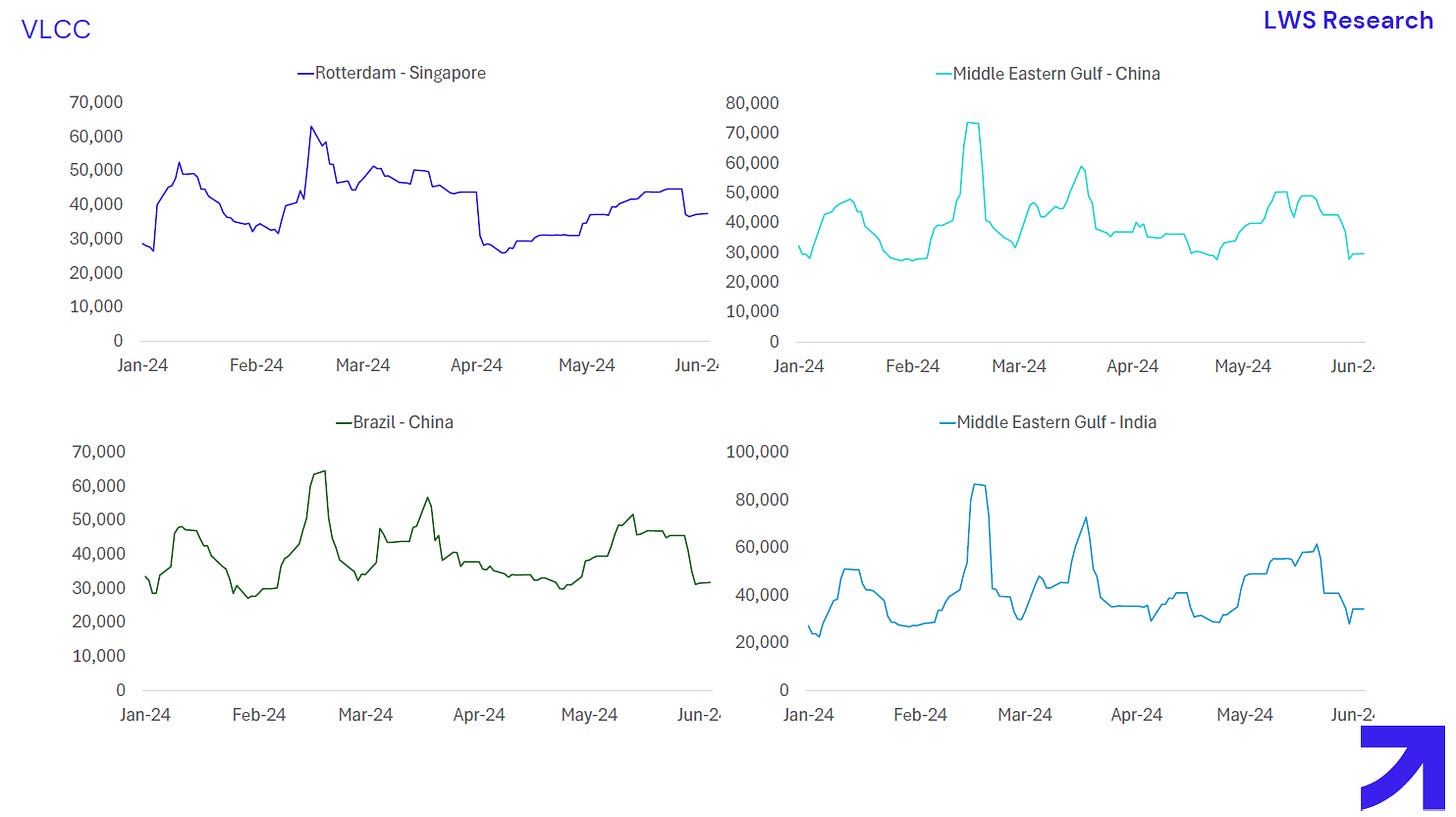
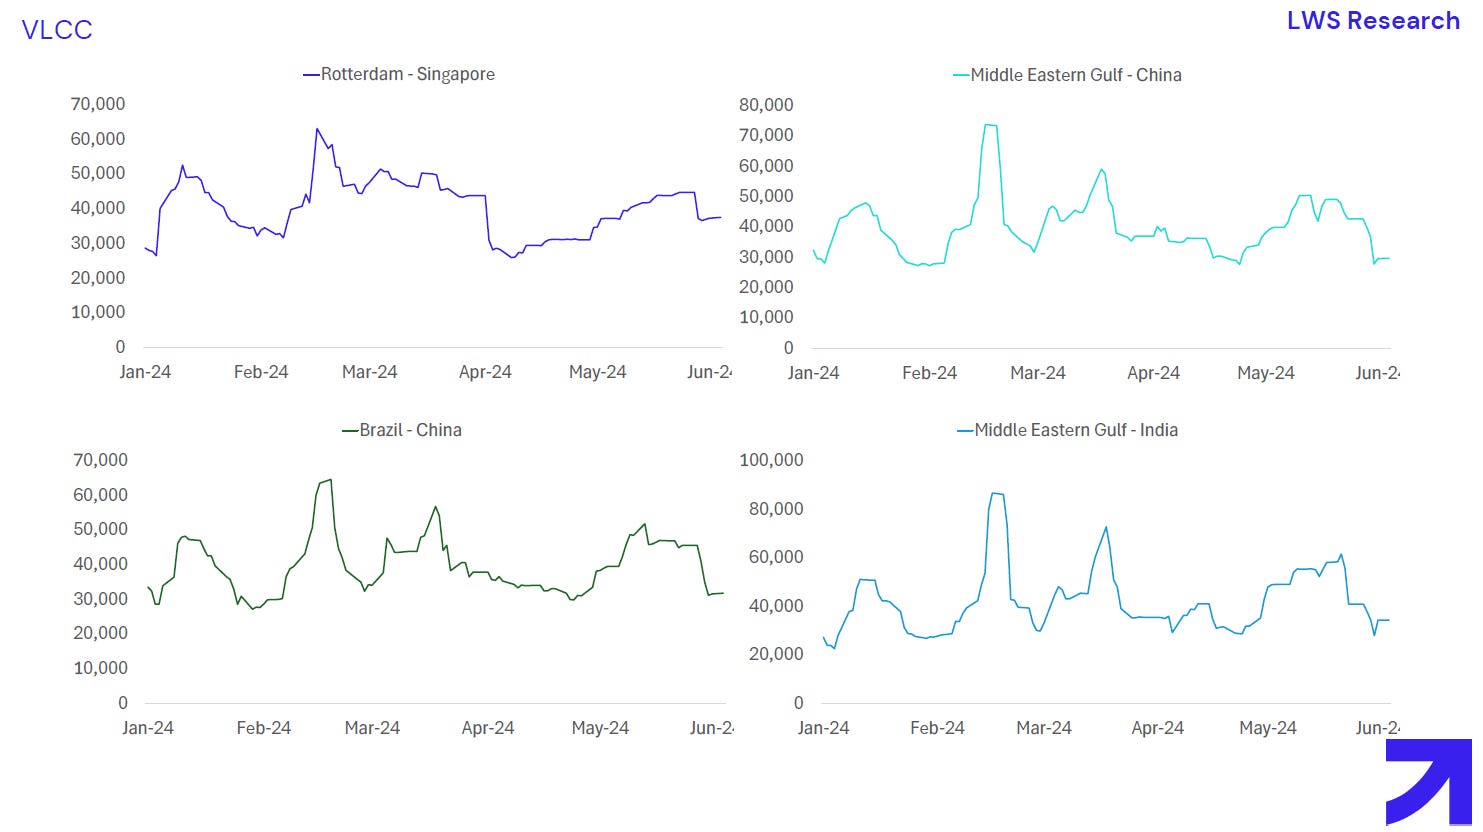
Shipping Rates Monitor: For each maritime transport segment and each of their main routes, weekly monitoring of the rates.
Panels with Key Macroeconomic Metrics and Commodity Prices.
These data are extracted from different sources(cost: $2500/month) and processed to present them in the most digestible way possible. We will use them to support several of our investment analyses. This is a first version, and we will be adding more data and refining the current ones based on the feedback you provide. If you are interested in receiving a sample before subscribing, you can write to me on Twitter.
Weekly macro summary
There have also been quite a few interesting events to analyze, and below I list the most noteworthy news. Let's get started:
Electoral uncertainty in two of the world's largest emerging economies, Mexico and India, has had a significant impact on financial markets.
In Mexico, Claudia Sheinbaum, former mayor of Mexico City and backed by the popular outgoing president Andrés Manuel López Obrador, won nearly 60% of the votes in a historic electoral victory. The ruling coalition was on its way to a possible two-thirds supermajority in both houses of Congress, which would allow it to pass constitutional reforms without opposition. However, this prospect has raised concerns in the markets. Since last Friday, the Mexican peso has accumulated losses of up to 5% due to uncertainty over possible constitutional changes and low fiscal discipline that could lead to uncontrolled public spending.
On the other hand, in India, stocks hit all-time highs, the rupee strengthened, and bond yields fell after exit polls indicated a landslide victory and a third term for Prime Minister Narendra Modi. The reality was very different: although Modi's party won the elections, it did so by a much narrower margin than expected, forcing him to negotiate to govern. The stock market turned around and had its biggest drop in over 4 years (8%), dragging down the commodity complex (India is the main growth hub for demand). Despite this, Indian stocks recovered some of the election losses on Tuesday, rising 3% after two key allies pledged their support to form a new government.
At the beginning of the year, we already anticipated that election years are prone to volatility and opportunities, and although these are not strictly economic events, they have a huge influence on the markets. At LWS Financial Research, we will continue to monitor these events to position ourselves in the best possible way (we have also been closely following the elections in South Africa, which are very influential for some of our positions).
The central banks of Canada and Europe have joined those of Sweden and Switzerland in deciding to cut their benchmark interest rates. With this move, 4 of the 10 countries that make up the G10 have begun to ease their monetary policy. In these two regions, inflation already appears to be within the 1%-3% range, where they can feel relatively comfortable and prioritize economic growth.
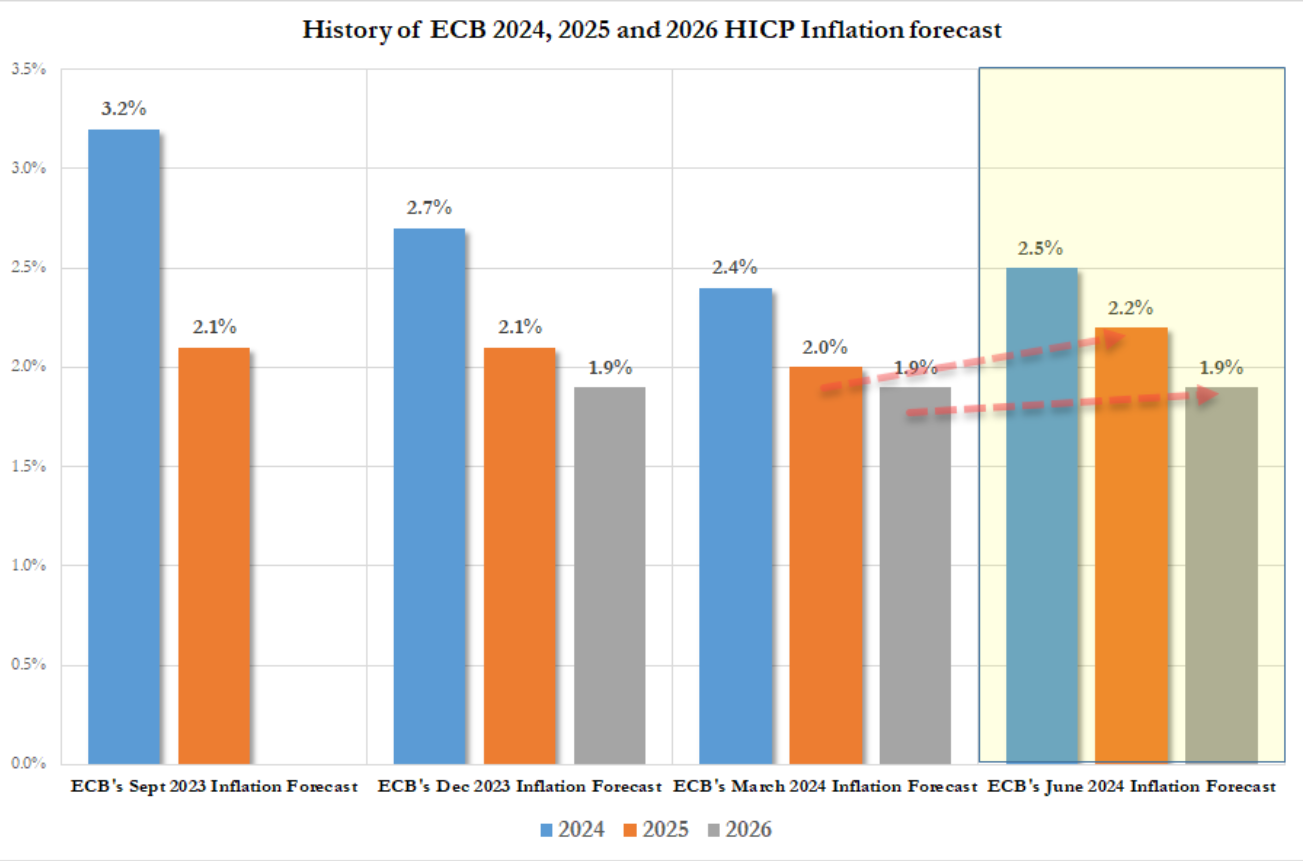
Not all the news was good at Lagarde's press conference. In a surprising shift in tone, the ECB increased its long-term inflation forecasts (above 2%) without this seeming to concern its leader. Understandably, with the amount of debt relative to GDP that Western economies accumulate, the only way to address this challenge is through higher inflation that reduces the real value of these obligations. It’s just that it shouldn’t be said openly.

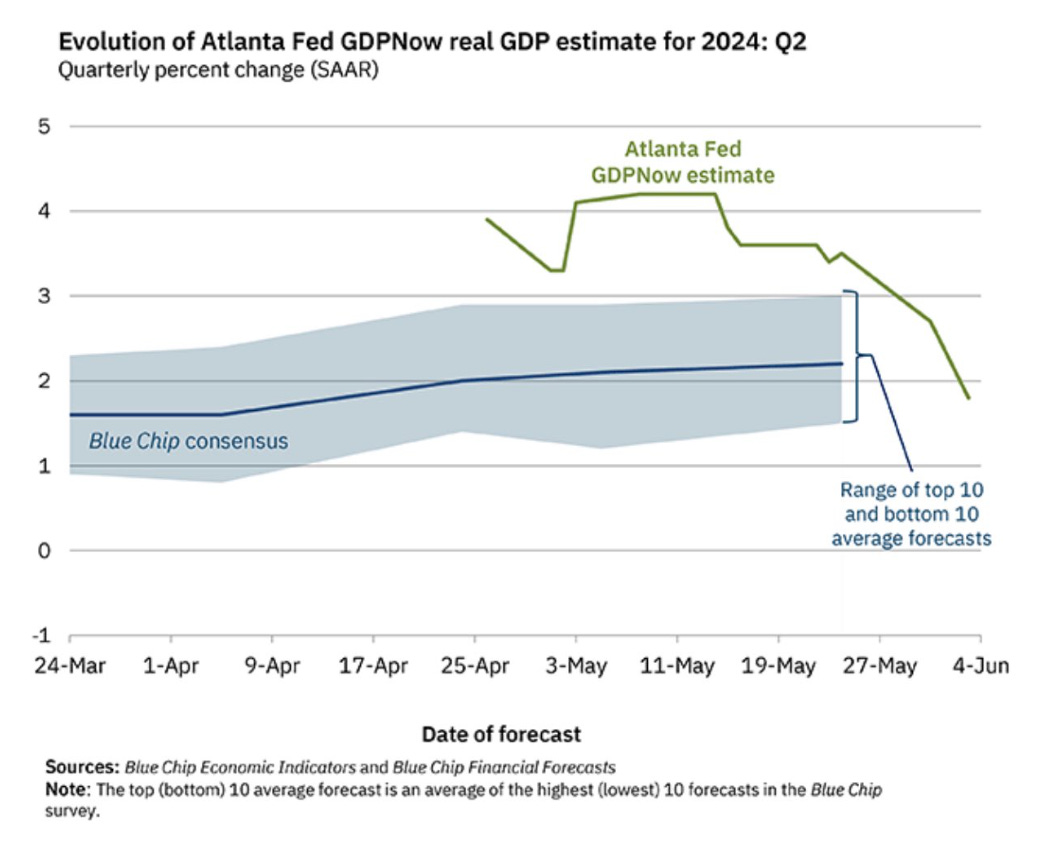
The latest ISM manufacturing survey in the United States showed a deeper contraction in May's activity than expected. In fact, one of the most widely used tools to track U.S. economic growth in real time, the Atlanta Fed's GDPNow, showed a sharp decline, dropping from over 4% a month ago to the current 1.7%.
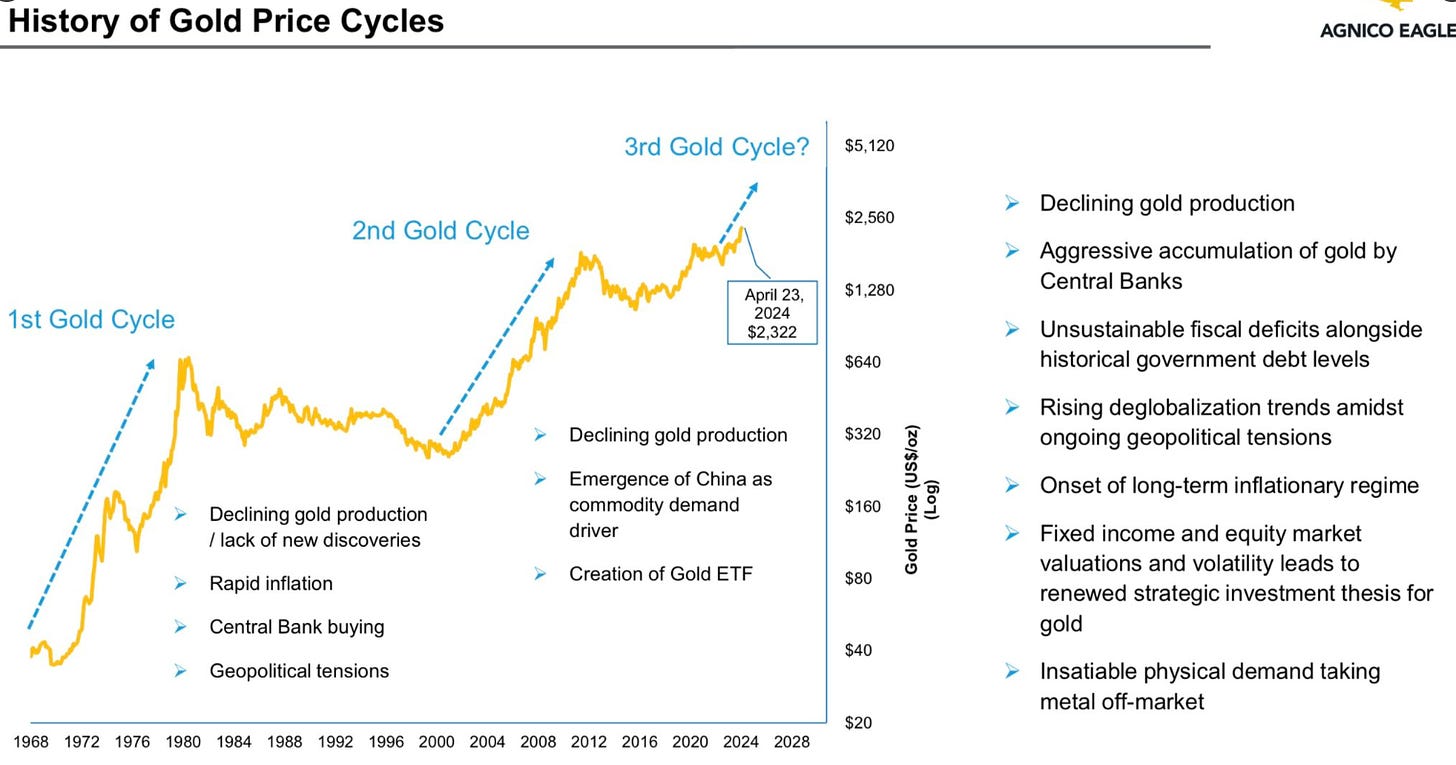
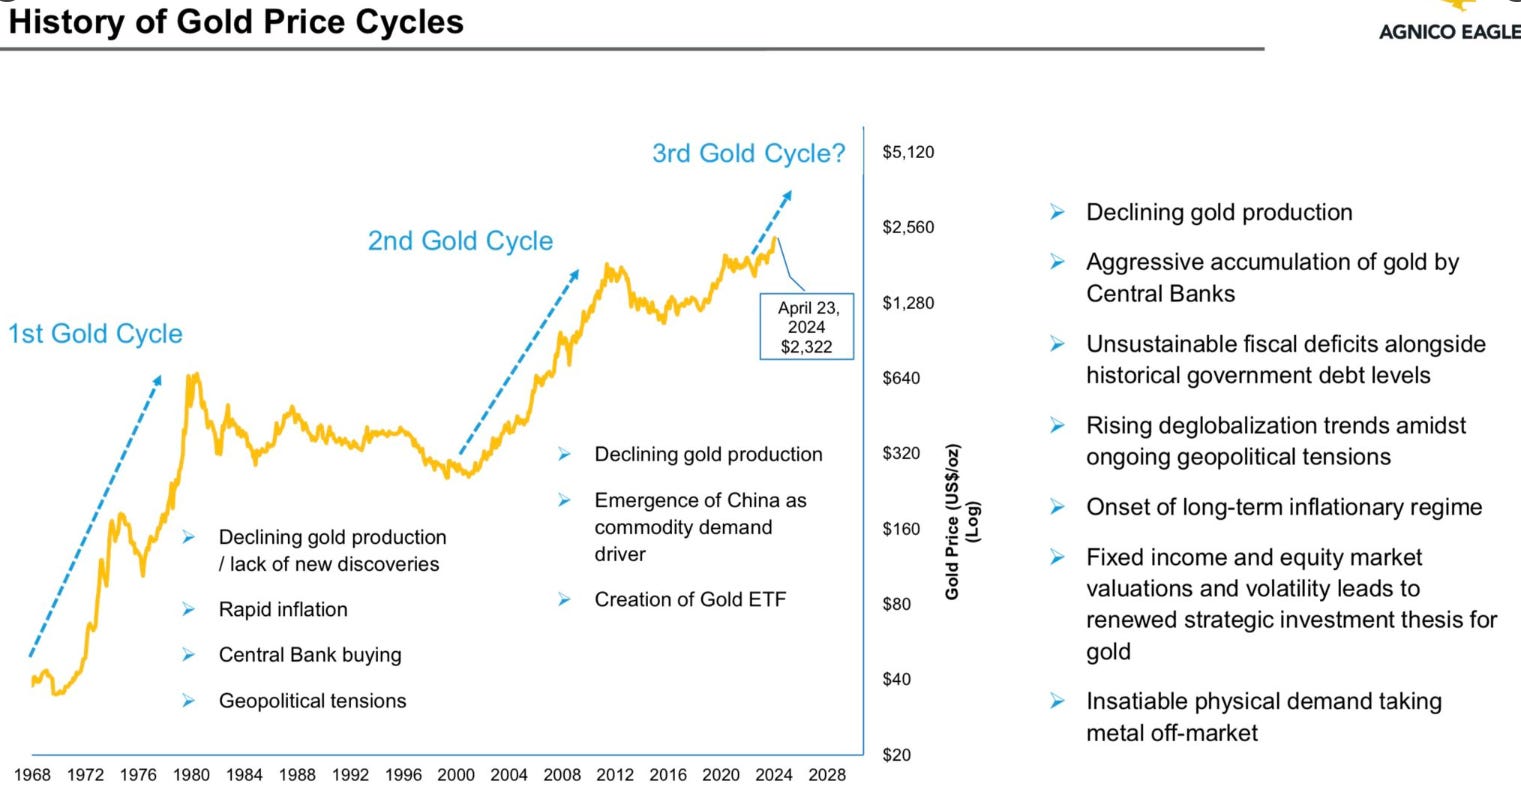
With the release of Friday's nonfarm payroll data, which were higher than expected, pessimism returned to the markets, especially in commodities and precious metals, which suffered significant declines (as we have noted in our model portfolio). The pause in purchases of gold by the Central Bank of China in May did not help in this regard either. As is almost always the case, the details are the most important, and if we analyze the employment report that triggered the fall, we find some surprises: although nonfarm payrolls show a significant increase, the unemployment rate rose to 4.0%, which we believe better reflects reality due to the lag in the BLS estimation models regarding business closures and the decline in new business formation. It is likely that the true pace of job creation is below 100,000 per month. The fundamentals supporting the rally in gold (and silver) are clear and significant, and in my opinion, this is just a bump in the road.
This week's EIA oil inventory figures have been very surprising: +1.23Mb of oil, +0.854Mb in Cushing, +2.102Mb of gasoline, and +3.197Mb of distillates. Increases in all categories. These results would already be surprising at the start of the seasonally strongest period, but they are even more so when considering that the detail of the data implies refinery consumption of 17Mb/d and exports of 4.5Mb/d, which far exceed production + imports in the same period. If we look at the modified adjustment data, we see that the EIA itself is aware that there are barrels whose origin it does not know (7Mb). This should be corrected in upcoming reports.

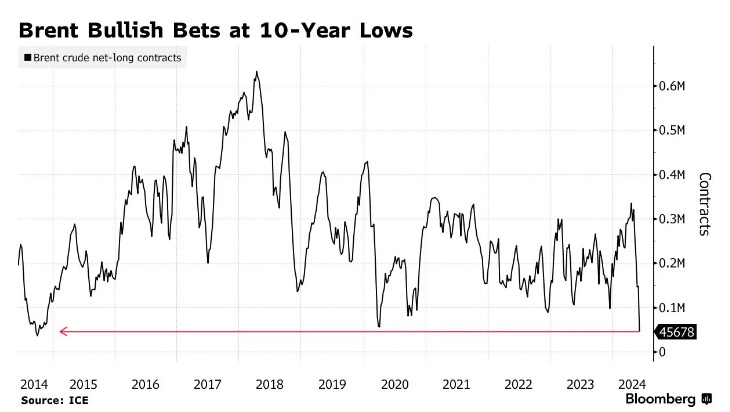
In the oil market, it's rare to reach a fair equilibrium based on fundamentals, and sentiment plays a big role. It all started after the announcement to extend production cuts by OPEC+ over the weekend, but they left the door open to revising them at the end of Q3. The market interpreted that since it's likely that some of the sequestered volumes will return to the market, this is negative for prices. Nothing could be further from the truth: the cartel is leaving the door open to balance the market if the deficits they foresee materialize in this third quarter, but if the market still shows weakness, they can extend the cuts for a longer time. Optionality.
As we can see in the following chart, this week's abrupt price drop has a clear explanation: investor positioning is at its lowest point in the last 10 years (yes, even worse than in 2020). However, fundamentals continue to show signs of stabilization, and both refining margins and physical timespreads are moving in the right direction.
In the end, it's always the same.


Model Portfolio
Nvidia has become the second most valuable company in the world, surpassing Apple and now only behind Microsoft. Michael Mauboussin, one of the finest and most renowned market analysts, has published a new article dissecting the current market concentration situation. The concentration of the top 10 most relevant companies has already reached 27%, the highest figure since 1962, and shows a clear upward trend.

This situation alone does not predict poor market performance: 30% of funds beat their benchmark index when concentration increases, although ideally, the opposite is true, where 47% of funds beat the indices. It reflects the "winner takes all" motto and is not surprising, considering that from 2014 to 2023, the 10 largest companies have represented, on average, 19% of capitalization but 47% of profits.

What is truly relevant to me is not so much the success of these giants and their (justified) significant weight in the stock markets, but rather the fact that they mask a much more concerning underlying reality, where the vast majority of companies are not able to generate any real value.
The model portfolio's return is +18.71% YTD compared to +11.79% for the S&P500, and +55.58% versus +33.17% for the S&P500 since inception (September 2022).
Keep reading with a 7-day free trial
Subscribe to LWS Financial Research to keep reading this post and get 7 days of free access to the full post archives.