

Weekly summary 15/06
Weekly summary 15/06
EIA's report - a critical look

Disclaimer
LWS Financial Research is NOT a financial advisory service, nor is its author qualified to offer such services.
All content on this website and publications, as well as all communications from the author, are for educational and entertainment purposes only and under no circumstances, express or implied, should be considered financial, legal, or any other type of advice. Each individual should carry out their own analysis and make their own investment decisions.
We now have the second version of the weekly report from LWS Research! Compared to last week, we have included the following improvements:
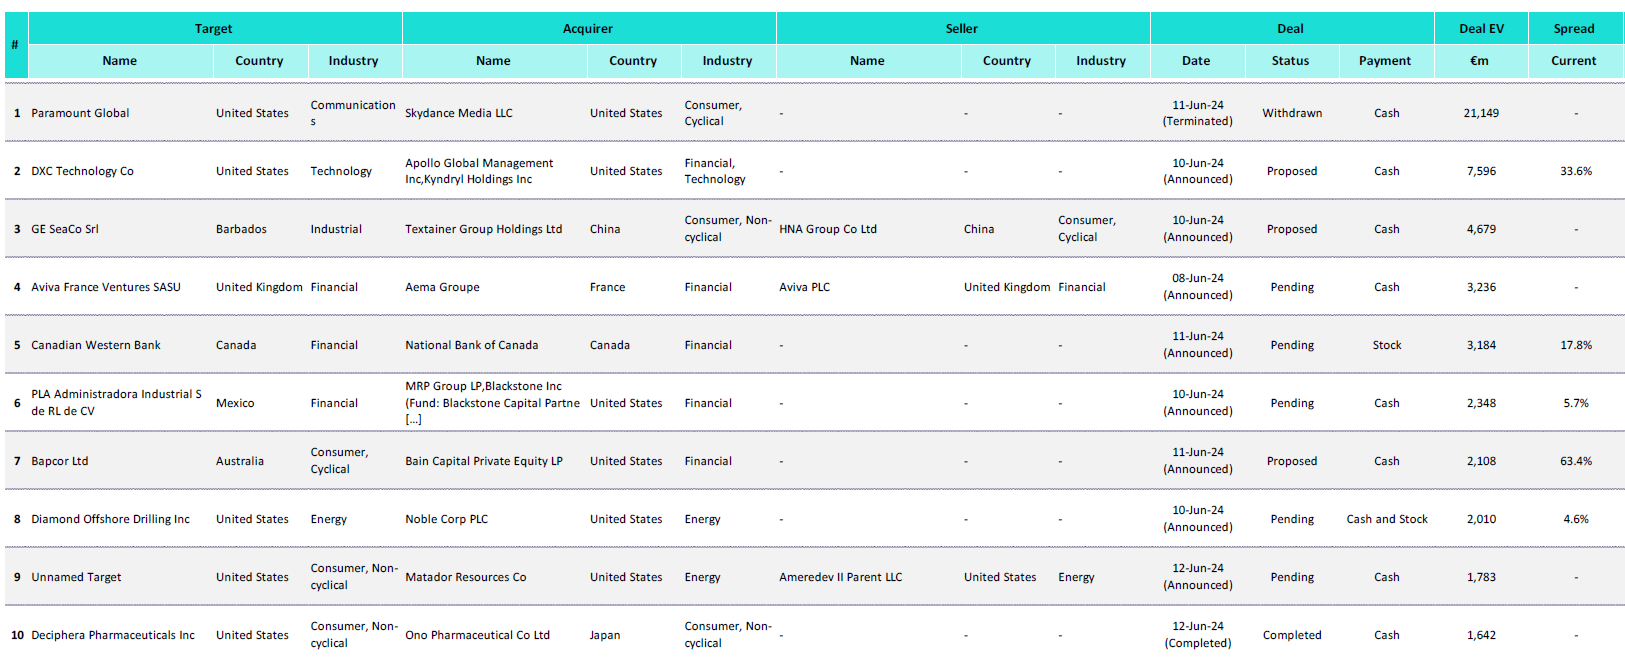
Special situations now include the spread for tracking and selection.
Much more detailed coverage of shipping routes.
Much more valuable information for commodities, such as real-time production and inventory data, to correctly assess the market balance.

We will work on this information in Discord to translate it into actionable market ideas every weekend. If you are interested in receiving a free sample, send me a private message here.
Weekly macro summary
There have also been quite a few interesting events to analyze, and below I list the most noteworthy news. Let's get started:
The May CPI data provided relief to the market and the Fed, as it showed a 0% MoM price growth (leaving annual inflation just above 3% on a TTM horizon). Once again, the main obstacle to reaching the 2% target was housing (shelter), which, as we've explained many times, is a very particular indicator: the CPI tracks two types of rents. One is the rent of primary residence, reflecting the actual expenses of tenants. The other is OER (Owners' Equivalent Rent), estimating what homeowners would pay if they rented their properties instead of owning them.
This distinction is important. Primary residence rent directly impacts renters, showing their real living costs. OER, on the other hand, influences homeowners' perception of housing costs by evaluating how much they could get if they rented their properties. This is key for economic policy decisions.
With energy and food prices moderating, it's unlikely that we will see a significant second wave of inflation in the short to medium term.

Later on Wednesday, we had the FOMC meeting, where the reference interest rates were kept unchanged, followed by Powell's press conference, which has already become one of the market's favorite shows. Some of the most relevant messages from the Chairman were the following:
Our strategy is not to wait for something to break and then fix it. We are simply waiting to have more confidence that inflation is going to drop to 2% [...] Regarding employment divergences, there are ambiguous data we have to deal with, but it remains a balanced labor market.
Not even he believes the employment data. For 2024, only one rate cut is expected, bringing it down to 5.1% (revised upward), instead of the three cuts anticipated in March. This signals a more hawkish stance. For 2025, the forecast is 4.1%, also revised upward from 3.9% in March. Traders are pricing in a roughly 65% chance of a quarter-point hike in September and almost fully pricing in a move by the November meeting, which is two days after the U.S. presidential election. This reflects a shift in market expectations toward a tighter monetary policy in the short term.
In my opinion, economic data will worsen sooner, and we'll see the Fed rush to cut rates two to three times this very 2024. In the following dot plot, we see that despite four FOMC members not expecting rate cuts this year, there are eight members (a majority) advocating for two cuts.

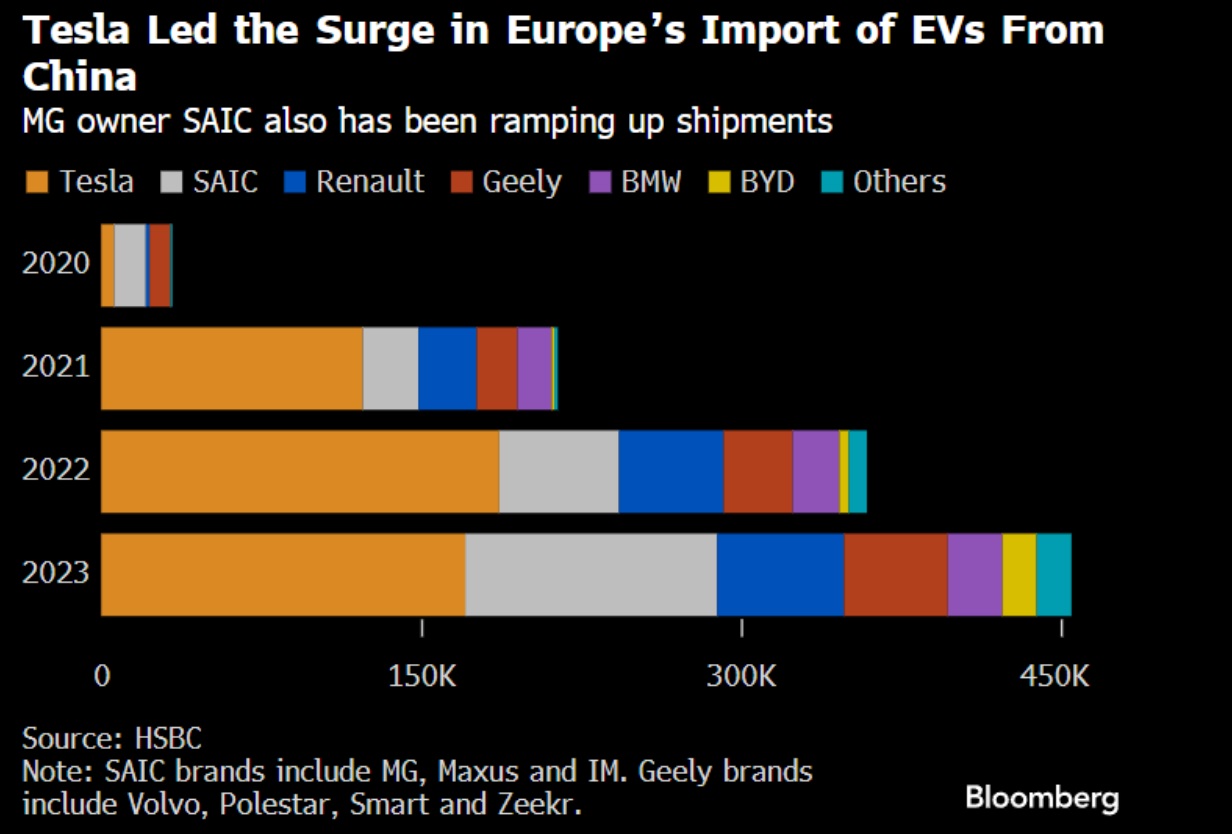
Brussels will impose tariffs of up to nearly 50% on Chinese electric vehicles, disregarding the German government's warnings about the risk of a costly trade war with Beijing. These tariffs will add to the current 10% tax on all Chinese electric vehicles, depending on the level of cooperation with the EU investigation. Some major exporters, such as BYD and Geely, could face additional tariffs between 17% and 20%, while European brands like Mercedes and Renault, which export electric vehicles made in China, will pay 21%. Tesla might receive an individually calculated tariff rate.
We have no choice but to act against the growing import of heavily subsidized battery electric vehicles from China.
— Valdis Dombrovskis
Either that or improve productivity.
The Chinese Ministry of Commerce expressed high concern and strong dissatisfaction, warning that it would take all necessary measures to protect the rights of Chinese companies. Germany, Sweden, and Hungary have expressed their disapproval, fearing Chinese retaliation.

Across the Atlantic, Tesla shareholders voted to restore the record $45 billion compensation package for Elon Musk, which had been overturned by a Delaware judge, showing strong confidence in his leadership. Musk will not receive the stock compensation immediately, as the judicial process in Delaware is still ongoing, and it reopens the debate on the extent to which public function should take precedence over voluntarily made decisions in the private sector.
The company is at a very delicate point, with a drop in sales and profit margins due to the slowdown in demand for electric vehicles, although there is excitement about the transformative potential of some projects (which never seem to arrive) like robotaxis or Optimus.

Musk had been reluctant to develop more artificial intelligence and robotics applications unless he had at least 25% of the vote, as he wanted to ensure the authority to direct and control the course of advancement. With this agreement, they now have the green light to proceed.
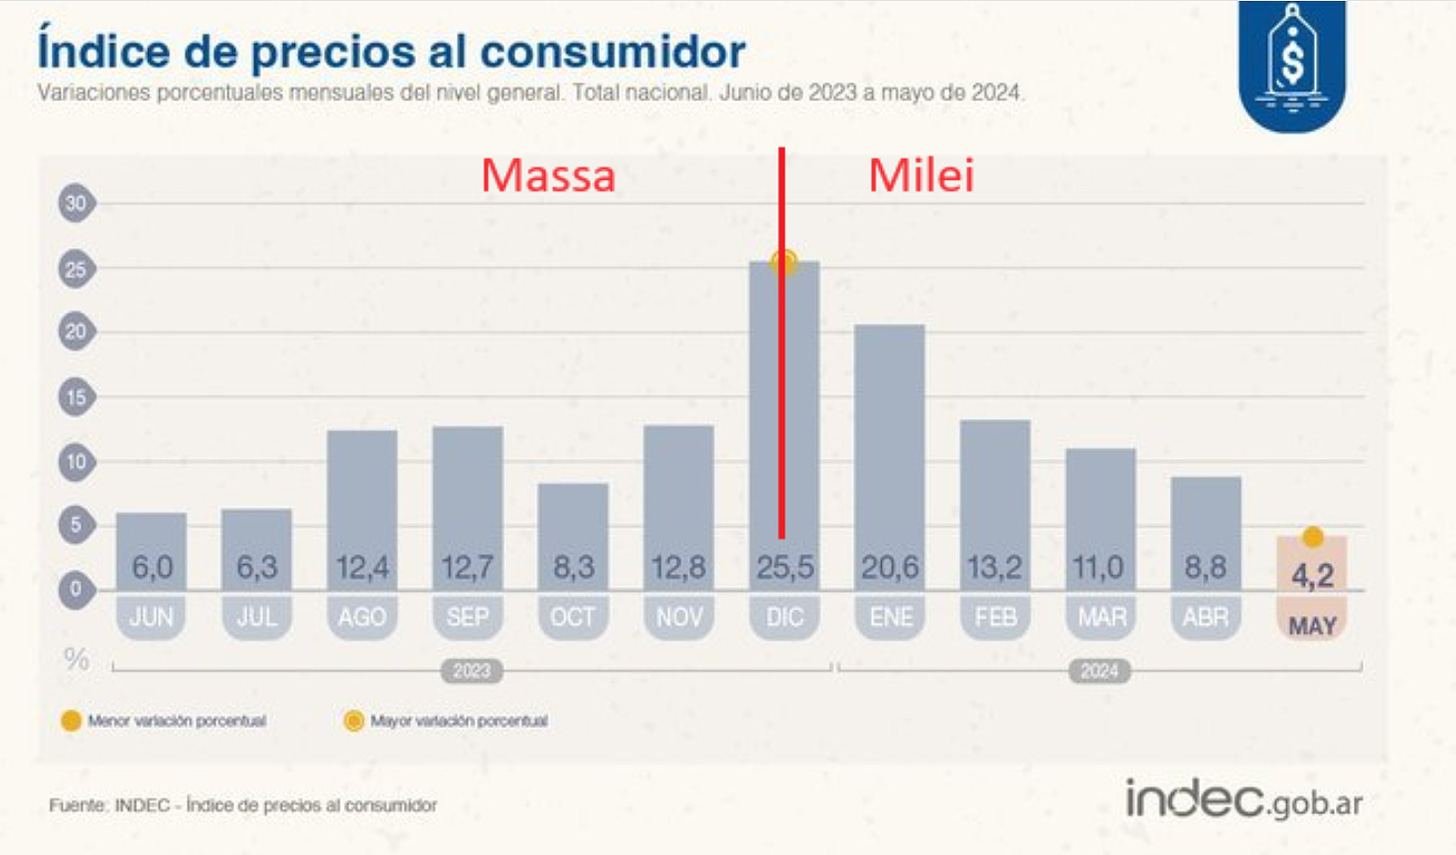
The fiscal and budgetary responsibility policies of Javier Milei are starting to bear fruit. The monthly inflation rate for May has fallen to 4.2%, its lowest level in the last two years. Although the path will not be linear, and short-term economic stress will be high, it is the only possible way to achieve real and true improvement that will make the national economy functional again.
Argentina and its transformation, with its underlying wealth and potential, represent one of the most attractive investment ideas today, which we are closely following in our community and Discord. Long live freedom, damn it.
The EIA is rapidly losing credibility. This week’s inventory report again showed surprising data: +3.73Mb of crude, -1.59Mb in Cushing, +2.56Mb of gasoline, and +0.881Mb of refined products, which is truly strange considering it stems from a 1.5Mb WoW demand drop (in the other oil category) and a record level of imports.
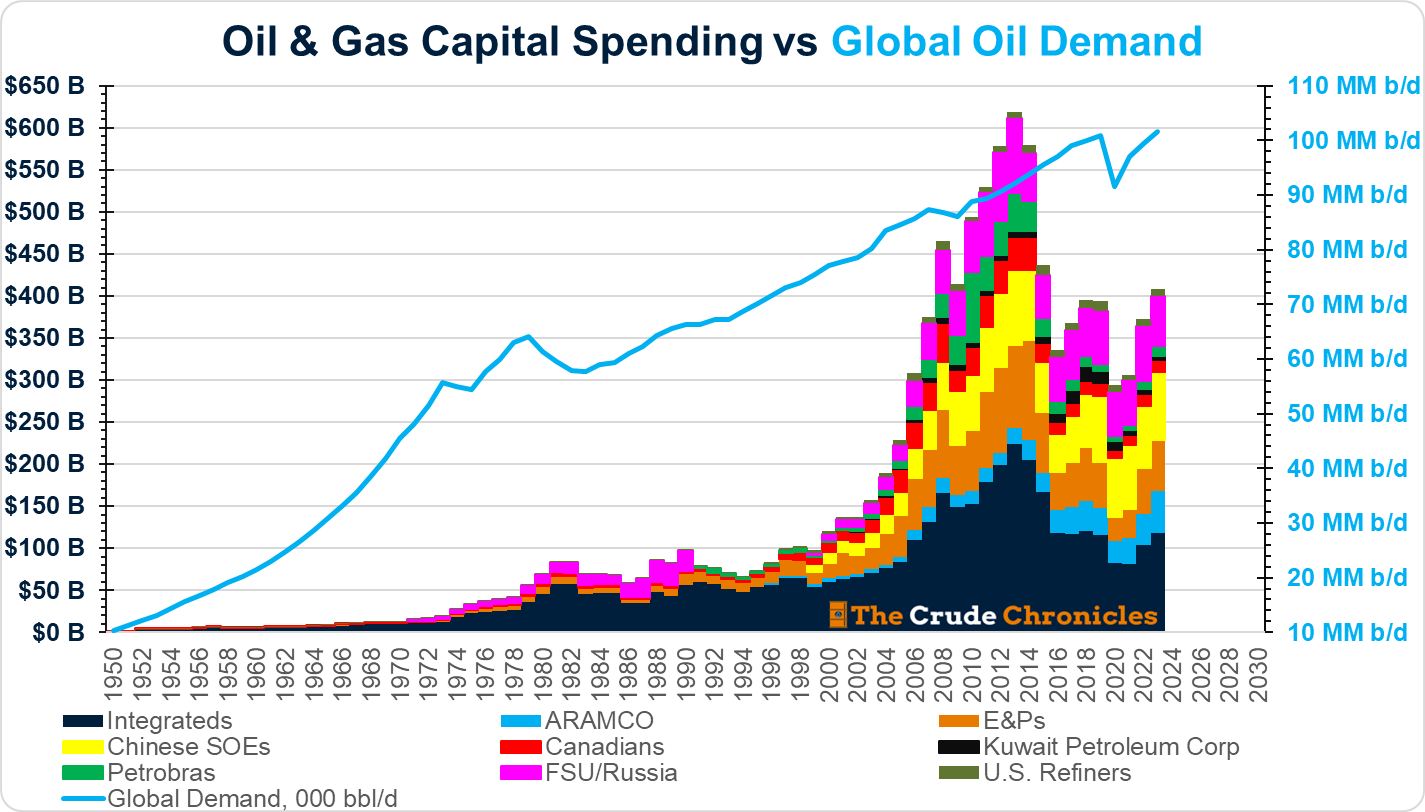
However, the most significant publication from the agency this time is not these figures but its medium-term outlook report, which seems more like a political propaganda exercise. The big headline from the IEA report is that global oil demand will peak by 2030, and oil producers will face a surplus of up to 8 million barrels per day due to electric vehicles and the energy transition movement. Since the Industrial Revolution, there has been a close correlation between oil demand growth and GDP growth. As emerging countries develop, energy intensity decreases, but the relationship remains intact, which directly contradicts these forecasts. The current global oil demand is exceeding all IEA "scenarios." Achieving the NZE numbers for 2030 seems like science fiction. The oil demand forecasts for 2030 are approximately: 105.4 million barrels per day according to the STEPS scenario, 104.5 million according to the APS scenario, and 83.7 million according to the NZE scenario.
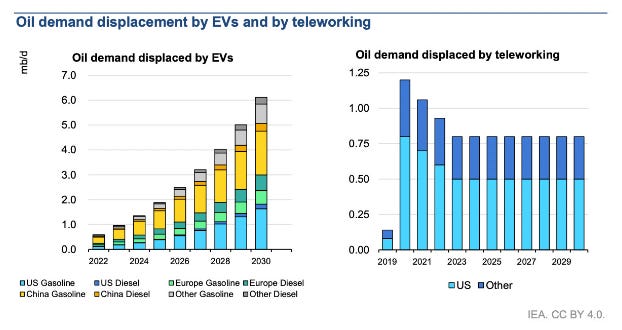
The great hope is the massive adoption of electric cars, but even in these dream scenarios, the numbers don't add up. In G&R's Q4 commentary, "the Norwegian illusion," they explain how the impact on oil consumption from large-scale adoption is not as significant as one might expect. Even assuming a 90% penetration rate in the USA, the effect on gasoline demand would only be -10% (800kb/d), far from the predicted -20%.

This report aims (as stated explicitly) to discourage new investment in oil exploration and development, warning of terminal value risks that these companies face due to the imminent peak demand and its subsequent decline. Some countries take it a step further, like the UK, which plans to renew the windfall tax (what is extraordinary about the current situation?) on oil companies. This will end up sinking investment in the North Sea and eliminate any possibility of energy autonomy and security in the country.

On the supply side, it is expected that U.S. shale, Brazil, and others will contribute approximately 2 million barrels per day of growth, of which the U.S. alone would account for +1.5Mb/d. This scenario now seems very distant, with the latest data from shale fields indicating a clear stagnation in the rate of production increase; in fact, some industry executives even forecast a production decline of 1Mb/d for next year if a barrel price that incentivizes the deployment of new rigs is not reached (they estimate this price at $90 per barrel).

It is estimated that to keep production flat (i.e., to compensate for the natural decline of the fields), the annual investment needed is about $500 billion in 2022 real terms, a figure slightly lower than the current one. However, as we have seen in the previous chart, there are some areas and fields (Guyana, Brazil...) with an easier and cheaper path to provide short-term growth.


Model Portfolio
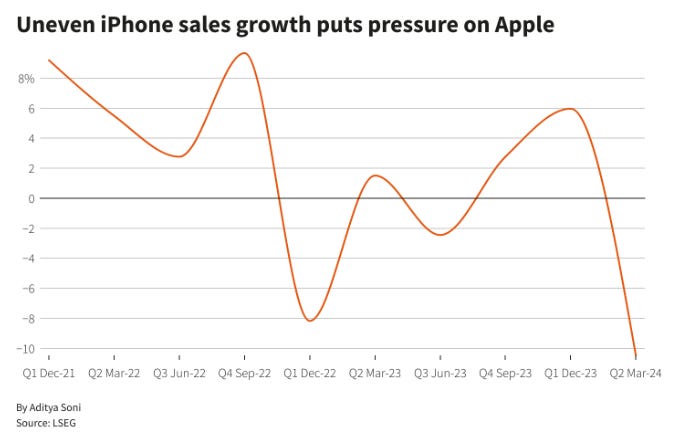
Apple has registered one of the best weeks in the markets in its history, with a 12% increase between Tuesday and Wednesday sessions, returning it to the second place in the global pantheon. The annual corporate event revealed its plan to integrate AI into its products, with a collaboration with OpenAI as the highlight announcement. It remains paradoxical and surprising that the only one of the big tech companies that has made no advances in artificial intelligence is one of those most rewarded by the market. Apple continues its ex-growth trajectory, with no real growth in recent years, yet it celebrates by trading at historic highs.
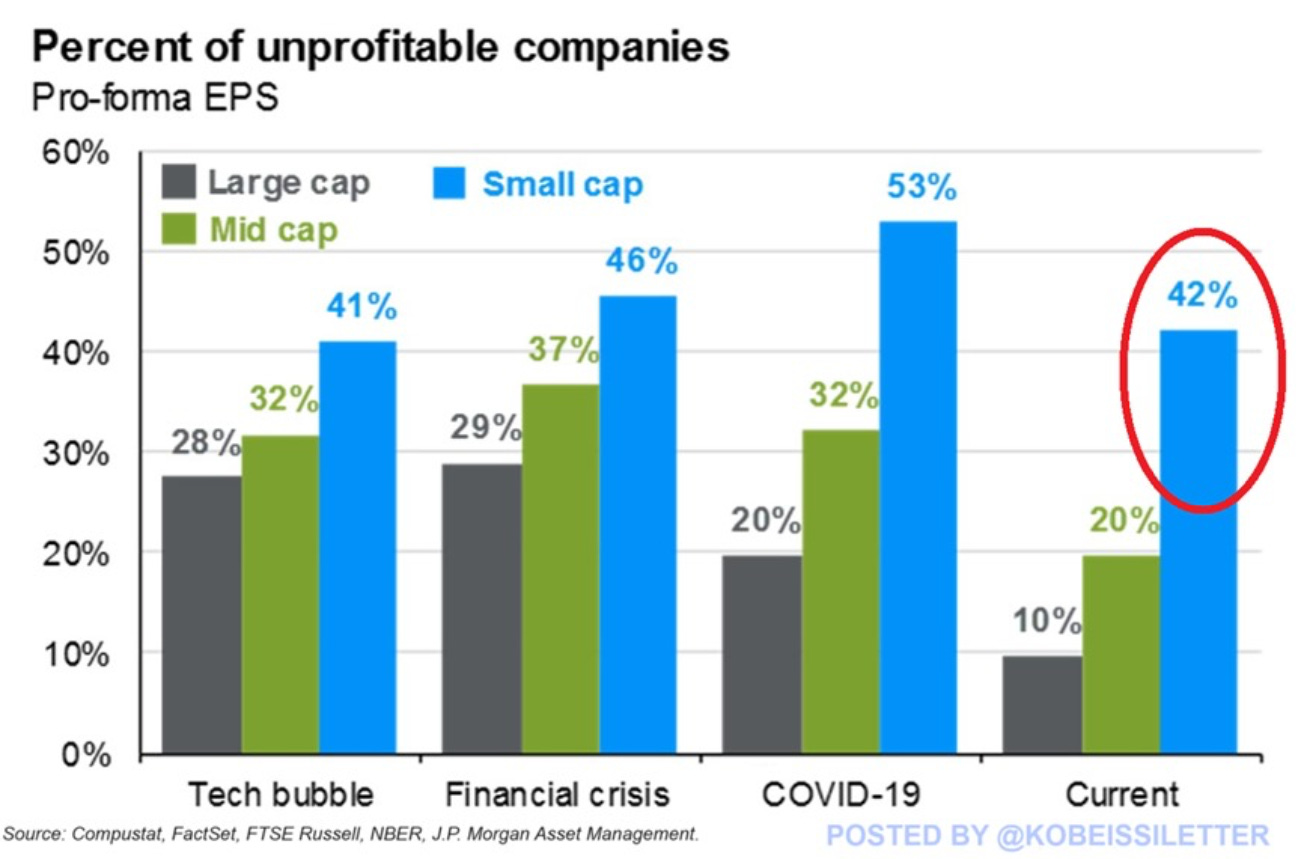
Building on last week's reflection, what concerns me more is not so much the market concentration (and specifically the rises in it) in a few names, but the underlying reality of many other companies that are unable to grow in real terms and, in many cases, be profitable. In the following chart, we can see the percentage of companies, by size, that fail to generate profits, which has already reached levels comparable to those of the Great Financial Crisis for smaller-cap companies. Probably nothing.
The model portfolio's return is +16.02% YTD compared to +13.27% for the S&P500, and +52.89% versus +34.65% for the S&P500 since inception (September 2022).
Keep reading with a 7-day free trial
Subscribe to LWS Financial Research to keep reading this post and get 7 days of free access to the full post archives.