

Weekly summary 20/04

Disclaimer
LWS Financial Research is NOT a financial advisory service, nor is its author qualified to offer such services.
All content on this website and publications, as well as all communications from the author, are for educational and entertainment purposes only and under no circumstances, express or implied, should be considered financial, legal, or any other type of advice. Each individual should carry out their own analysis and make their own investment decisions.
Weekly macro summary
There have also been quite a few interesting events to analyze, and below I list the most noteworthy news. Let's get started:
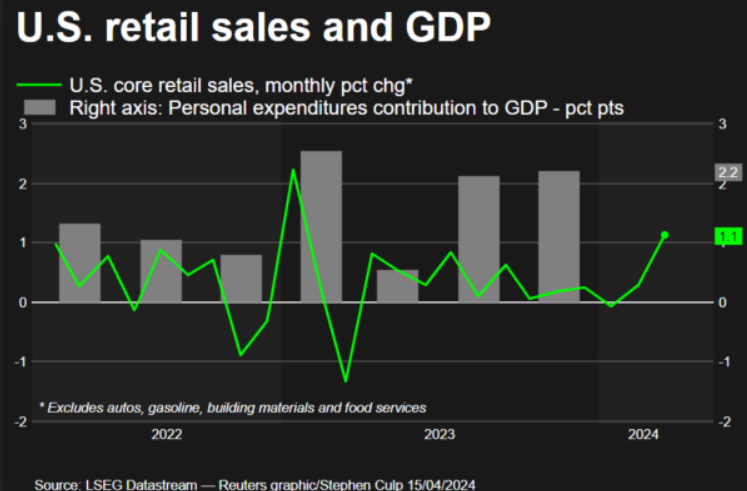
Just one month ago, the FED had planned three interest rate cuts for the year, and in this week's appearances, they hinted that there might be one or none, even opening the possibility for further increases. Economic data continues to be very positive, with the increase in retail sales (+1.1% MoM) being the latest example of this, which puts no pressure on the central bank for the second leg of its dual mandate.
Jerome Powell and other representatives of the Fed have confirmed that inflation is proving to be more persistent than they expected, and that the path to the 2% target will be slow and tortuous, so it is likely that restrictive policy will need to remain in place for a longer period.
The recent data have clearly not given us greater confidence and instead indicate that it's likely to take longer than expected to achieve that confidence.
— Jerome Powell
For us, the endgame has been clear for some time, and judging by the evolution of opinion articles, it won't be long before it arrives: if they find it impossible to reach the 2% inflation target within a reasonable time frame, they will change it and problem solved, which is their preferred option, as it helps inflate the debt. Killing two birds with one stone.
Since last Friday, the market has been on edge, holding its breath, to see if there would be (and in what form) a retaliation from Israel for the drone and missile attack carried out by Iran. Although Tehran warned in advance, and there were no human casualties (Israel was able to intercept virtually all projectiles), the Netanyahu government immediately warned that they would respond (risking further escalation). The United States and the rest of Tel Aviv's allies warned that they would not support any action leading to escalation, and even tried to persuade the president to accept defense as a victory and move on, but Israel's delicate balance in the region made some sort of response inevitable. Finally, the retaliation came on Thursday night, with a bombing in the city of Isfahan, in Iranian territory.

The limited scale seems to have left everyone satisfied, as the Tehran government has announced that they consider the matter closed, greatly reducing the risks of escalation and open war in the region.
The economic data from China has been relatively positive, although it shows some underlying shadows: GDP advanced by 5.3% YoY, retail sales by +3.1% YoY, and industrial production by 4.5% YoY, but inflation figures (already in deflationary territory) and those related to construction and real estate investment fell sharply and are concerning.
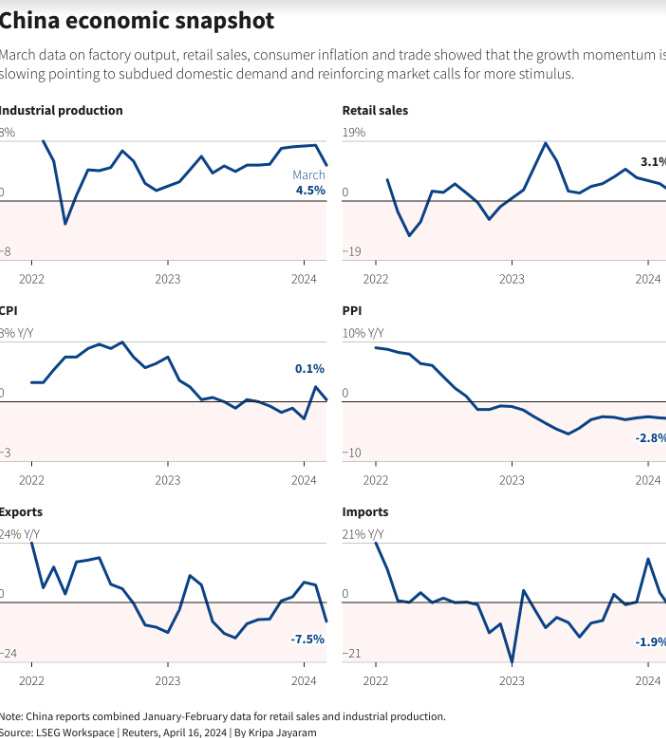
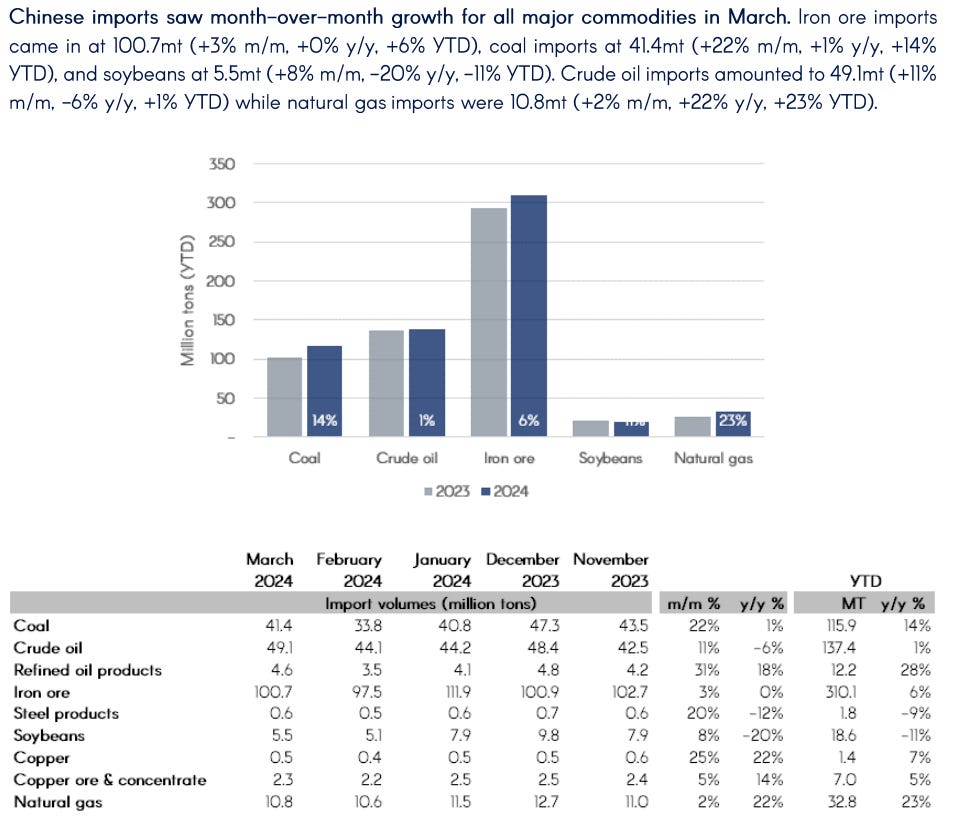
Despite the narrative of how these data points are very weak and pose an underlying problem for commodities, if we look at the figures, we see a significant increase in imports (although it is true that imports do not equate to consumption) in key industrial metals and energy inputs.
In a context of weakness in the world's largest consumer of industrial metals, the behavior of two of them is still surprising, and we are closely monitoring: copper and tin.
Copper has broken through $4.5/lb, and there are already several analysts predicting the ever-elusive supercycle, riding on large supply deficits and strong demand, led by China's industrialization and urbanization, which could push the price to $5/lb.
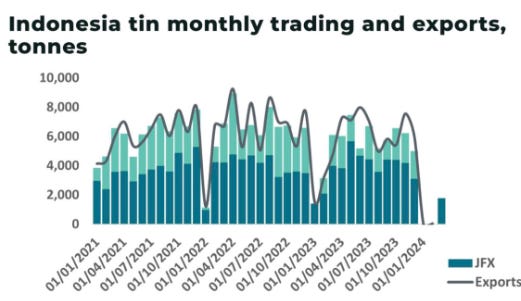
Meanwhile, tin continues to rise without an apparent ceiling, and that's because, as we have been predicting for months, the perfect storm is forming. It all stems from a very complicated situation regarding supply, with Myanmar practically out of the market, the world's largest producer, Indonesia, has also run dry at the beginning of this year due to a corruption scandal that has reached the highest political levels of the country.

To add fuel to this fire, financial players, who smell blood, are positioning themselves very aggressively on the upside, with the largest bet since 2018. The price, which is already around $36k/t, certainly shows signs of experiencing a squeeze, with significant upward jumps daily.

And the question now is: Is there enough tin to carry out the digital revolution?
Continuing with last week's thread, today we bring the following chart, which shows how, despite record prices, the demand for gold from Western investors, characterized through the behavior of Americans, is minimal. When they realize the underlying monetary paradigm shift that is taking place, and appetite inevitably returns, the current rally could be even more magnified.

Today, at approximately 1 AM, the fourth Bitcoin halving occurred, whereby mining rewards are halved to 3.125 BTC. This event, which happens roughly every 4 years, is one of the most significant catalysts for the price of the crypto asset, as it effectively halves the new supply.

Meanwhile, the presumed entity that has been accumulating BTC since late 2022, whose identity is still unknown, continues to buy in blocks of 100 the entire new daily supply (700-900 BTC/day), which will now put much more pressure on the price, as there are not enough BTC being mined to even meet the demand of this specific actor.

Volatility has been extreme this week, and we have seen sharp declines related to geopolitical tension, despite which the price closed around $64K/BTC, which is particularly noteworthy considering the streak of capital outflows from ETFs we have had in recent weeks.

The halving is fundamentally a very positive event for the price of Bitcoin, and even more so this year, where it adds to a long list of catalysts; as a reference, exactly 4 years ago, in the previous halving, the price was $8,821/BTC, which is 7x less than now.
This week we've had another negative oil inventory report: +2.735Mb, +0.033Mb in Cushing, -1.154Mb of gasoline, and -2.76Mb of distillates. With these figures, all the inventory consumption from Q1 has been wiped out in these two weeks, so we're back to square one.

In a surprising move, after turning a blind eye to Iran, which is selling more oil than ever, mostly to China, and to Venezuela itself, the Joe Biden administration threatens to reimpose sanctions on Caracas (thus ending a 6-month grace period, during which they were supposed to hold fair and transparent elections).
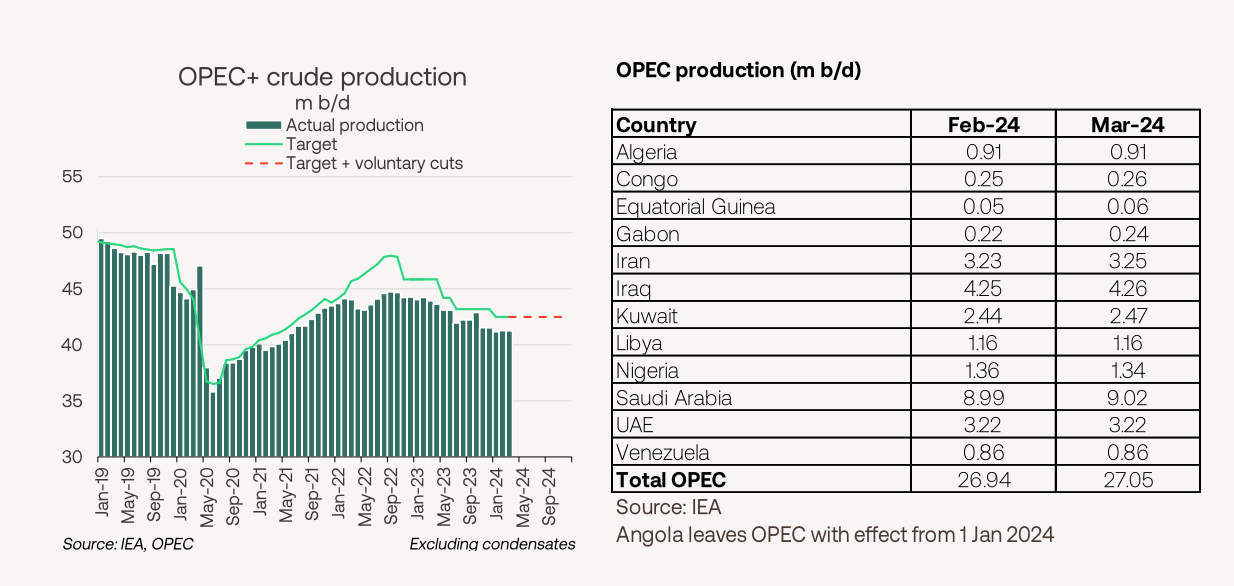
Although demand seems to have stalled, awaiting the summer driving season, supply is also not picking up pace. In the following chart, we can observe OPEC's production volumes vs. their assigned quotas, and how, despite voluntary cuts, they have not been consistently meeting them since 2020.
In a humorous (or not so much?) twist, could oil (and gas + coal) be a second-order play of AI? According to this McKinsey forecast chart, the electricity demand of data centers, an imperfect proxy for AI, would multiply by 2.5x in the next 6 years, reaching 8.1% of total US consumption; to meet these forecasts, ceteris paribus, and assuming a similar trend in other regions, a significant capital deployment would be necessary to boost supply.

We are witnessing a peculiar situation, partly driven by geopolitical tensions, which carry positive tail risks, where major funds and traders are selling their positions in upstream companies to switch to bullish bets on the oil price itself. As further evidence that electric vehicles, at least in their current version, are not a technology suitable for mass adoption, Volkswagen's EV sales, until recently one of the most successful brands in this regard, are following Tesla's path and have dropped by 25% in Europe; it is becoming increasingly clear that the terminal value of E&P has been underestimated.


Model Portfolio
Despite market volatility and the poor performance of indices, driven by geopolitical noise and the tax season in the USA, which has reduced liquidity, we have achieved a positive return for the model portfolio this week, at 1.76%. The model portfolio's return is +17.7% YTD compared to +4.1% for the S&P500, and +53.92% versus +25.48% for the S&P500 since inception (September 2022).
Keep reading with a 7-day free trial
Subscribe to LWS Financial Research to keep reading this post and get 7 days of free access to the full post archives.