

Weekly summary 27/04

Disclaimer
LWS Financial Research is NOT a financial advisory service, nor is its author qualified to offer such services.
All content on this website and publications, as well as all communications from the author, are for educational and entertainment purposes only and under no circumstances, express or implied, should be considered financial, legal, or any other type of advice. Each individual should carry out their own analysis and make their own investment decisions.
We already have the schedule for upcoming publications ready, and the weeks ahead are packed with content:
Tomorrow, we will publish a new investment analysis of the company Duratec ($DUR).
Throughout the next week, we will start sending out comments on the earnings presentations of the companies we are tracking.
Monthly live session for subscribers and launch of a new content format, in presentation form, highlighting the main insights of the week, both on Discord and for the markets we follow.
Weekly macro summary
There have also been quite a few interesting events to analyze, and below I list the most noteworthy news. Let's get started:
The Fed has a problem. Thursday's economic and inflation data outlined the worst possible scenario for the central bank, with growth much lower than Q4 (1.6% YoY vs. 3.4% YoY in the previous reading) and higher inflation (PCE Core +3.7% YoY) than expected. Quarterly economic progress was worse than expected due to weakness in consumption, marking the second consecutive deceleration, and this scenario, coupled with rising prices, is disastrous news for the Fed, as it points to a stagflation scenario. If they can't maintain price stability (first mandate) or economic stability (maximum sustainable employment), what do they have left?
If this is the scenario we are heading towards, it is crucial to study which asset classes may perform well, and the most recent and paradigmatic example of this macro context is found in the 1970s. As we can see in the following table, broken down for each year from 1970-1979, gold (including silver) was the star asset, followed by commodities, while the big losers were stocks (indices) and technology. What's interesting about this key is that these asset classes (precious metals and commodities) do not require this scenario, which is not my base case, to shine, but in the event we head towards it, they would represent the most interesting choice. Position accordingly.

Studying history is a very underrated activity (and knowing it, a skill) in the markets.

In a new episode of USA vs China, the United States Senate has approved the ban of the TikTok app in the country if its parent company, Bytedance, does not sell it to a local company. The rationale behind the move is based on perceived, though not yet proven, risks to national security.
For years we've allowed the Chinese Communist Party to control one of the most popular apps in America; that was dangerously shortsighted. A new law is going to require its Chinese owner to sell the app. This is a good move for America.
— Marco Rubio
Meanwhile, Bytedance will appeal the ruling, arguing that it goes against the principles of the free market, especially since no criminal or dangerous behavior has been proven. However, if push comes to shove, they prefer shutting down rather than selling to a competitor, as compromising the algorithm would have implications for other jurisdictions where they operate. This represents a negative trend, contrary to one of the principles that has characterized the American liberal spirit, although the Western drift in the field of competition is no longer surprising.
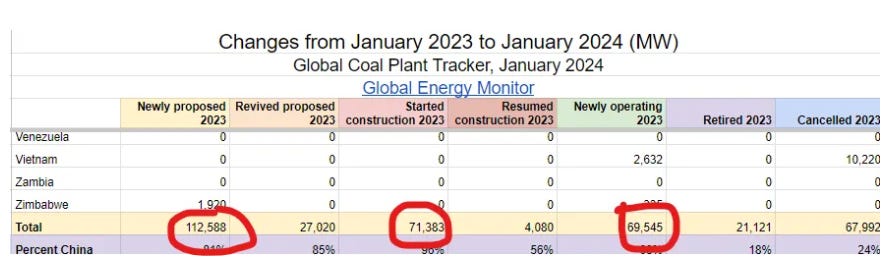
Vietnam is demanding that coal miners increase their production levels to avoid blackouts this summer. Low water reserves, which threaten hydroelectric generation, and the recent escalation of LNG prices have raised alarms in the government, which has decided to boost coal generation to ensure energy security.
In fact, despite the consensus narrative on the phase-out of this fossil fuel, if we look at the data on the construction of new coal-based power plants, we can see that it is still a technology experiencing growth, with very significant net additions, mainly concentrated in developing countries rather than in the OECD.

Recently, the EIA has shared its forecast on the evolution of the main energy sources up to 2050, where they estimate a 1% decline in oil (after a previous peak in 2030), a slight increase in natural gas (here I believe they will deviate significantly from the final reality, with natural gas growing at much higher rates than anticipated), a significant growth in renewables and nuclear, and an IMMEDIATE collapse in coal consumption, which does not correspond to the data on the increase in current electric plants. It's all a collective fantasy and delusion, and investing based on these projections carries many more risks than apparent.

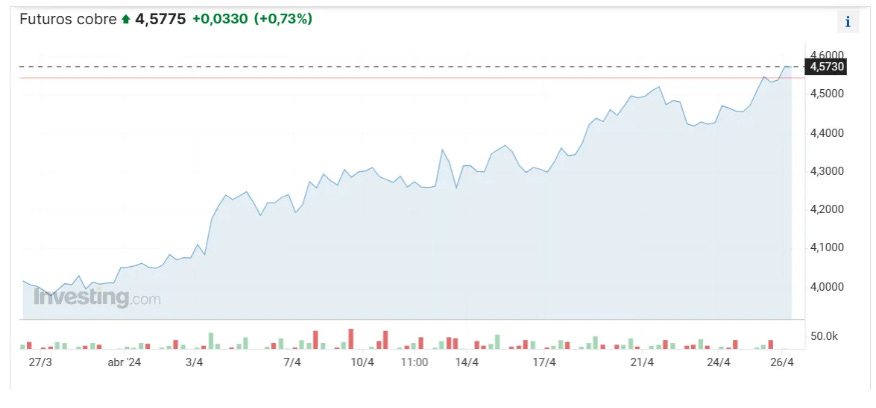
BHP has set out to lead one of the biggest M&A operations in the mining sector's history. The British (and Australian) giant has made an offer, valued at £31 billion, to acquire its competitor Anglo American, aiming to expand its portfolio of transition commodities, especially copper. In fact, if the deal is approved, the combined entity would become the world's top copper producer, with a market share of approximately 10%.
Recently, the price of this metal, which benefits from several global megatrends (electrification, energy transition, electric vehicles...), has soared, experiencing a significant bullish rally, reflecting supply problems (Panama, Codelco...) that could lead to a significant deficit in the market balance as early as 2024.

Recently, commodities trader Trafigura, one of the largest, has forecasted that EVs, artificial intelligence, and the energy transition will increase demand by at least 10Mt in the next 10 years (40% of the current demand). Therefore, unless technological innovation allows for the substitution of these copper uses or significantly improves its efficiency, the growth and demand prospects are stellar.
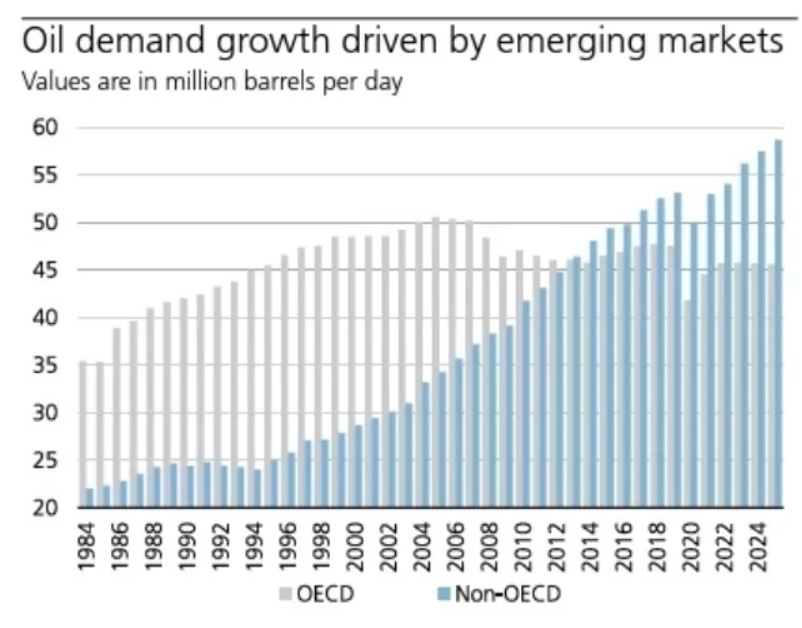
We've had a surprising, upward data point from the EIA's petroleum inventories: -6.368Mb, Cushing -0.659Mb, gasoline -0.634Mb, and distillates +1.61Mb. The implied oil demand increased by 0.315Mb/d WoW, reaching 19.5Mb/d. Taking a global view, demand growth in the coming decades will come from non-OECD countries, from emerging economies, but seeing that volumes are also holding up in the West is very positive.

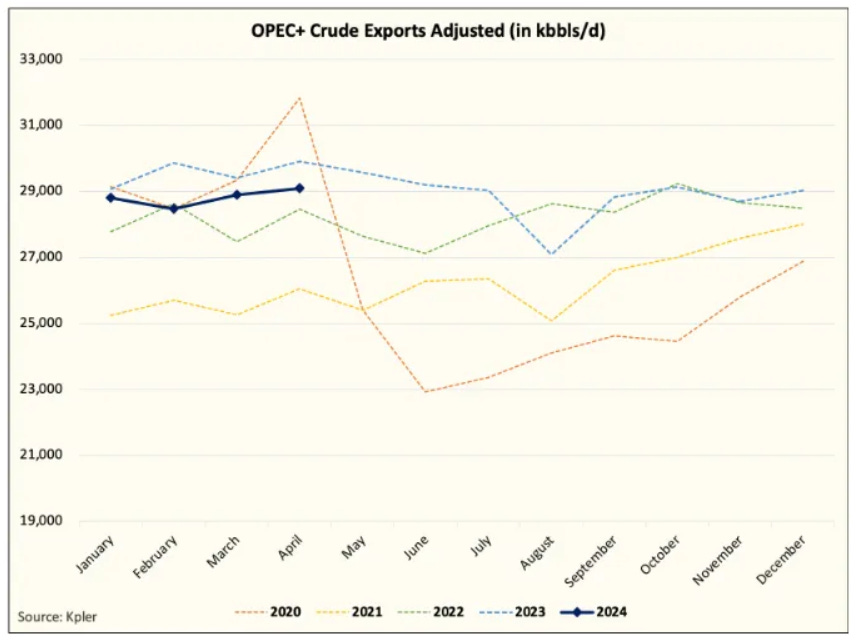
We're approaching the summer driving season with a balanced market, which is an improvement over early year (and 2023) estimates, and could lead to a relaxation of voluntary production cuts by OPEC+, which would be very positive for certain segments of maritime transportation. Speaking of these cuts, if we look at specific export data, we can see that they are not occurring to the extent announced, and only Saudi Arabia is complying with them, which makes it more sustainable and paints a more bullish picture for crude oil.


Model Portfolio
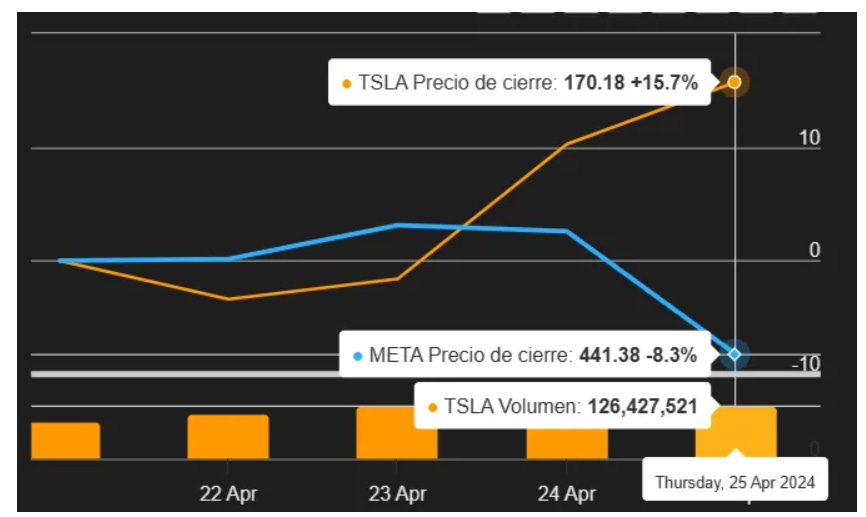
The earnings season, featuring several big tech companies, market pillars, has started with strong emotions. Initially, Tesla's numbers were deeply disappointing, with a QoQ decline and a negative cash flow of $2.5B for the quarter, breaking the upward trend of recent years; the market reacted positively (+13%) to the report, not because it was good (it was a disaster) but because of the expectations already priced in (-42% YTD, although it still seems expensive to me) and Elon's promises for the future. In contrast, $META, which beat analysts' consensus, plummeted after announcing a significant new round of AI-related CAPEX (farewell, year of efficiency).
In either case, what truly surprises and, in my opinion, shows that the market is broken (valuations and common sense have completely disappeared) is that a report more or less in line with expectations can make stock market value disappear (or be added) by hundreds of billions of dollars.
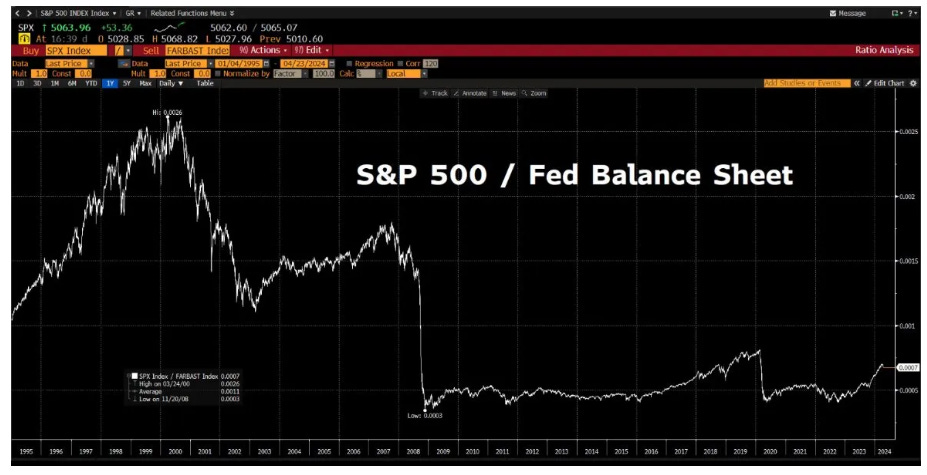
The underlying reality explaining the distortion in markets and valuations is the significant increase in the Fed's balance sheet since the Great Financial Crisis. If we divide the performance of the S&P500 by the central bank's balance sheet, we can see how, in reality, there has been no real growth in prices since 2008; that is, the increase in liquidity explains the entirety of the appreciation. This mechanism, perverse in its concept since it causes a clear Cantillon effect, must be accepted as it is and we should try to take advantage of it as much as possible.
The model portfolio's return is +21.62% YTD compared to +6.94% for the S&P500, and +57.84% versus +28.32% for the S&P500 since inception (September 2022).
Keep reading with a 7-day free trial
Subscribe to LWS Financial Research to keep reading this post and get 7 days of free access to the full post archives.