

Disclaimer
LWS Financial Research is NOT a financial advisory service, nor is its author qualified to offer such services.
All content on this website and publications, as well as all communications from the author, are for educational and entertainment purposes only and under no circumstances, express or implied, should be considered financial, legal, or any other type of advice. Each individual should carry out their own analysis and make their own investment decisions.
Weekly macro summary
There have been quite a few interesting events to analyze this week, and below I list the most noteworthy news. Let's get started:
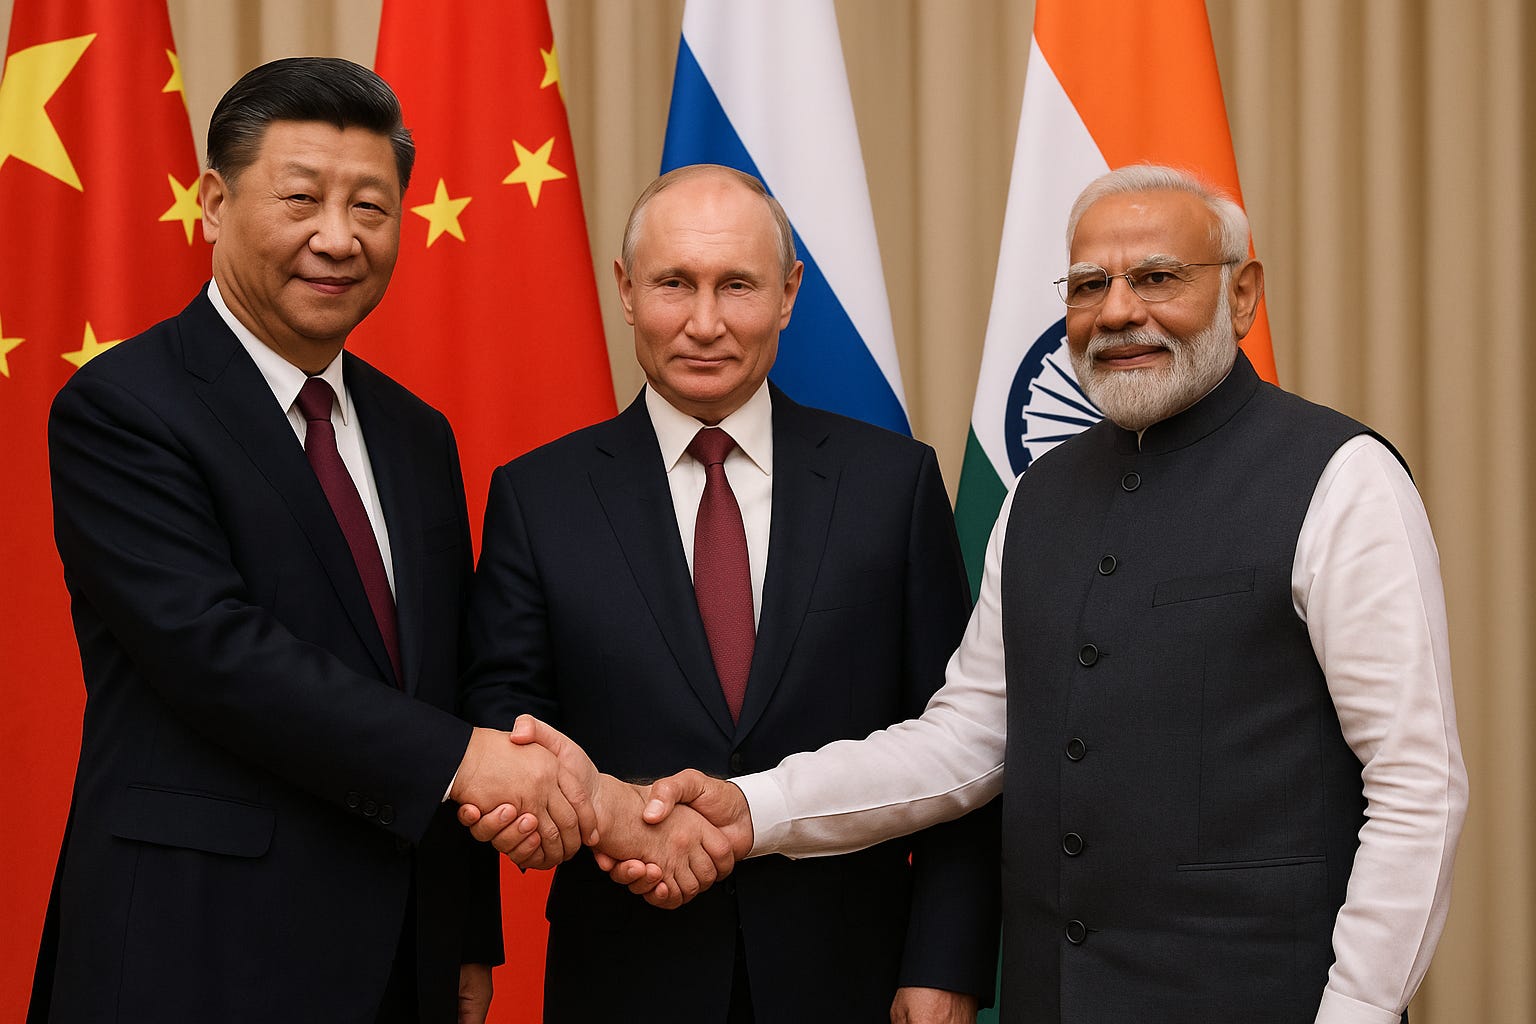
Xi Jinping is on the move again. At a carefully staged summit in Tianjin, the Chinese president gathered more than twenty leaders from the Global South under the umbrella of the Shanghai Cooperation Organization (SCO), in an explicit attempt to offer a geopolitical and economic alternative to the Western order. With Putin on one side and Modi on the other, the image left no room for doubt: what until recently was a regional security bloc now wants to become the institutional framework of a new multipolar system.
Xi did not offer concrete measures, but he rejected hegemonism (read: the United States), called for the creation of a development bank of their own, promoted an alternative payment system to the dollar, and advanced a narrative of technological cooperation —including a shared artificial intelligence center and an invitation to participate in China’s future lunar base. In other words, a parallel architecture to the Bretton Woods model, woven around common geostrategic interests and the growing discredit of traditional institutions.
Putin, true to form, spoke of “genuine multilateralism” and the increasing replacement of the dollar in the bloc’s transactions. Language matters, and this is no longer about resisting Western sanctions but about redesigning the playing field. The fact that India and China continue buying Russian crude despite pressure from Washington illustrates this clearly. The U.S. has imposed tariffs on New Delhi, but not on Beijing. Pragmatic to the end.
The real significance here is not so much the summit itself, but the shift in narrative. The SCO, while not yet a structural threat to the global system, is articulating symbols, rhetoric, and institutions that directly compete with those of the Western world. And it does so with a mix of nationalism, economic diplomacy, and a story that increasingly resonates with countries that feel excluded from the rules-based order.
The photo of Xi, Putin, and Modi is one for the history books.

Google, the most lagging and cheapest of the MAG7, is back at all-time highs. Judge Amit Mehta has issued a key ruling in the antitrust case against Google: the company will not have to part with either Chrome or Android. And although the ruling acknowledges that Google maintains an illegal monopoly in the online search and advertising market, the remedy imposed is much softer than what regulators and parts of the market had anticipated. The immediate reaction? Alphabet shares +7.2% after hours. And Apple, which also breathed easier, +3%.
The real winner here is the narrative, since Mehta acknowledges Google’s dominant position but chooses not to break up the company, citing the rise of AI as a factor reshaping the competitive landscape and further lowering barriers to entry for rivals. He argues that tools like ChatGPT represent a more real threat to the search engine than any competitor in decades. In other words, he is letting the market discipline the monopoly without drastic regulatory intervention. A symbolic victory for Google—and for all of Big Tech.
In return, Google will have to open its data vault and share part of its information with competitors —including developers of AI-based search engines— which is significant. Access to that data could be the catalyst the next generation of conversational search engines needs to erode its dominance. But the transition will take time and depends on user adoption. It is not an existential threat… yet. Of course, this is not over: the Department of Justice is considering an appeal, and the judge himself acknowledges that the case’s final destination is the Supreme Court. But Alphabet is hitting new highs as uncertainty over its competitive position in this new paradigm begins to clear.
Although this week debt markets seem to have found some superficial stability, underlying tensions in the long end of the yield curve keep growing—and not by chance. Thirty-year bond yields in Japan, the UK, the U.S., and France are flirting with highs not seen in decades, in a context where fiscal deficits and lack of budget credibility are becoming a global problem, even though most central banks are already cutting rates—and doing so very aggressively (they can control the short end of the curve, but not the long end).

Japan has been the epicenter of fear this time. The resignation of a senior official close to Ishiba reignited concerns about the sustainability of its debt—the highest in the developed world—and the 30-year bond comfortably exceeded 3% for the first time in its recent history. But this is not an isolated phenomenon. The UK hit 5.75% this week on its 30-year bond (a level not seen since 1998), while France and Germany are also seeing their long-term financing costs soar. And all this is happening precisely when governments need to issue more debt to finance rising expenditures—military, industrial, migratory—without a clear political framework to support a credible fiscal adjustment. The formula is explosive. In the UK’s case, for example, current deficits are comparable to those of the major wars of the past century.

In the U.S., yields also tightened—the 30-year reached 5%—before giving up ground after weaker employment data (a drop in job openings), which revived bets on Fed rate cuts this month. But even with those cuts on the table, the long end is not coming down. The reason: the problem is not (only) monetary policy, but fiscal policy. To cope with this debt burden, the only solution is inflation, which is our base case scenario and the one we are positioning the portfolio for.
Just like with uranium, the flow of positive fundamentals for gold keeps coming. Tether, the world’s largest issuer of stablecoins, is shifting part of its investment strategy toward physical gold. What began as an anecdote —a few bars in a vault in Zurich— has now turned into something more structural: a clear bet on the entire value chain of the metal, from mining to royalty companies.
The stated logic is simple: reserve diversification, exposure to real assets, and an almost ideological view of gold as “natural bitcoin,” in the words of CEO Paolo Ardoino himself. In truth, this vision is not new; Tether has long argued that gold should play a more prominent role as a reserve asset, even above sovereign currencies. But now they are putting money behind that thesis.
Central banks, as we know, share this same reserve thesis and, for the first time since 1996, gold has surpassed U.S. Treasuries as a percentage of reserves. With geopolitical rifts widening by the day, I do not expect this trend to change, and more and more institutions will adopt a hybrid approach to their treasuries. Gold and Bitcoin are not incompatible.

After the doubts over the legality of the tariffs imposed by the Trump administration, the following table is especially relevant, and I use it to gauge what to expect from the president’s policies, as he takes popularity and public opinion as the barometer of his initiatives. We can see the approval ratings for various social and economic aspects, and it is reasonable to expect that in those marked in green the trend will remain the same or accelerate, while there may be a U-TURN in the more unpopular ones.

Although the financial aspect scores poorly, far from slowing down—as many analysts suggest—the U.S. economy is reaccelerating, as shown by the latest ISM survey and its trend. This would provide a strong tailwind for the reduction of the real deficit, as well as for commodities and corporate earnings. Of course, this acceleration (run it hot) risks translating into renewed inflationary pressures, but this, while negative for the economy, would once again be very positive for equities, especially those held in the model portfolio.

Once again, rumors of a possible OPEC+ production increase, to be discussed this Sunday, have triggered a drop in crude prices, adding pressure to the consensus narrative of an imminent oil glut that would push prices down to around $50/b, as Goldman forecast last week. Let’s examine this.
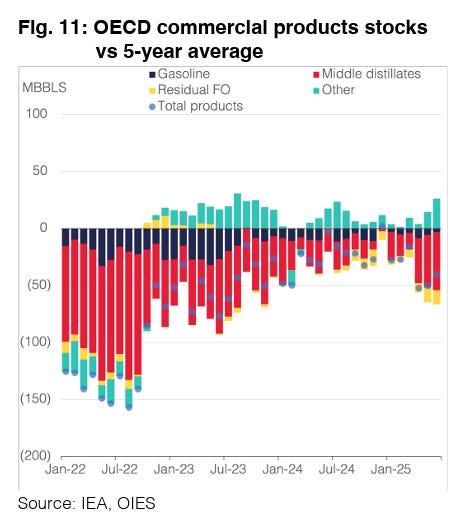
As we move into the third quarter, the dominant narrative continues to revolve around the threat of an oversupply in the global oil market. However, when we look at the data, projections of large surpluses have been steadily deflating. The IEA itself revised its historical estimates of global demand upward in May (+350 kb/d for 2024), turning the supposed surpluses of 2023 and 2024 (+280 kb/d and +190 kb/d) into deficits (-40 kb/d and -140 kb/d). If such a glut truly existed, it should be clearly reflected: inventories building up, price structures shifting into contango, and physical differentials weakening. But the data don’t support that. OECD commercial stocks rose by just 4 million barrels in the first half of 2025, standing at 2,758 mbbls at the end of June, far below the five-year average (-122 mbbls). Both crude and refined products are currently at relative lows.
The usual argument to sustain the glut narrative is that excess inventories are concentrated outside the OECD, with China as the prime suspect. However, here we face a problem of opacity: Beijing does not publish reliable data on its strategic reserves, much of which are stored in underground caverns. This lack of transparency distorts any global balance and complicates the underlying reading: is this planned strategic stockpiling, or just commercial movements linked to arbitrage? Floating inventories, which are verifiable, have sharply dropped in recent weeks.

Beyond crude inventories themselves, another signal of a large surplus would be a sharp rise in refined product inventories, if oil were being processed for later consumption. Yet, again, OECD data—the only figures regularly reported and cross-checked—show this dynamic is not taking place.

The same applies to spreads. If OPEC+ were truly feeding a large surplus, we would expect an abundance of heavy crudes and a widening Brent–Dubai spread. In practice, the opposite has occurred: the spread has narrowed, and at times Dubai has even traded at a premium to Brent—an unmistakable sign of tightness in the heavy segment.
The most plausible explanation is that many of the “projected surpluses” are more of a statistical artifact than a physical reality. Demand and supply models, especially for the non-OECD block, carry significant margins of error, which amplify when projecting balances. This is not the first time: the IEA’s revisions in May already transformed surpluses into deficits with a simple methodological adjustment. The result is a market where the oversupply narrative coexists with data pointing to a much tighter balance. Meanwhile, the curve and physical spreads, which reflect the real behavior of buyers and sellers, keep sending a clear message: there is no glut.
Finally, the other possible explanation is that the current consensus figures will end up being revised, as has happened repeatedly in recent years; for instance, the IEA recently revised its estimates of non-OPEC supply growth down by -340 kb/d compared to last year. Although the so-called OPEC 8+ group has officially announced an increase in its production ceiling of 1.37 mb/d between March and July 2025, the on-the-ground reality is different: effective production has only risen by about 890 kb/d, or around 65% of what was promised. On the demand side, the picture is no clearer. Discrepancies between OPEC and IEA historical consumption estimates have gone from being a marginal noise to becoming a real methodological problem. In 2024, the average gap between the two series hovered around 810 kb/d, but in the first half of 2025 it has already surged to 1.3 mb/d. That gap conditions any balance forecast and opens the door to diametrically opposed readings of “scarcity” or “abundance” of crude.
In fact, if we look at the historical relationship between OPEC production and manufacturing ISMs, we can clearly see how current figures are consistent with distinctly expansionary levels. Does MBS know something?


Model Portfolio
The model portfolio's return is +14.10% YTD compared to +10.71% for the S&P500 (our portfolio mesured in € terms, which is weighting -14% in our portfolio this year vs the S&P in $), and +91.1% versus +60.1% for the S&P500 since inception (September 2022). The model portfolio, as of Friday's close, is as follows:
Keep reading with a 7-day free trial
Subscribe to LWS Financial Research to keep reading this post and get 7 days of free access to the full post archives.