

Disclaimer
LWS Financial Research is NOT a financial advisory service, nor is its author qualified to offer such services.
All content on this website and publications, as well as all communications from the author, are for educational and entertainment purposes only and under no circumstances, express or implied, should be considered financial, legal, or any other type of advice. Each individual should carry out their own analysis and make their own investment decisions.
Weekly macro summary
There have been quite a few interesting events to analyze this week, and below I list the most noteworthy news. Let's get started:
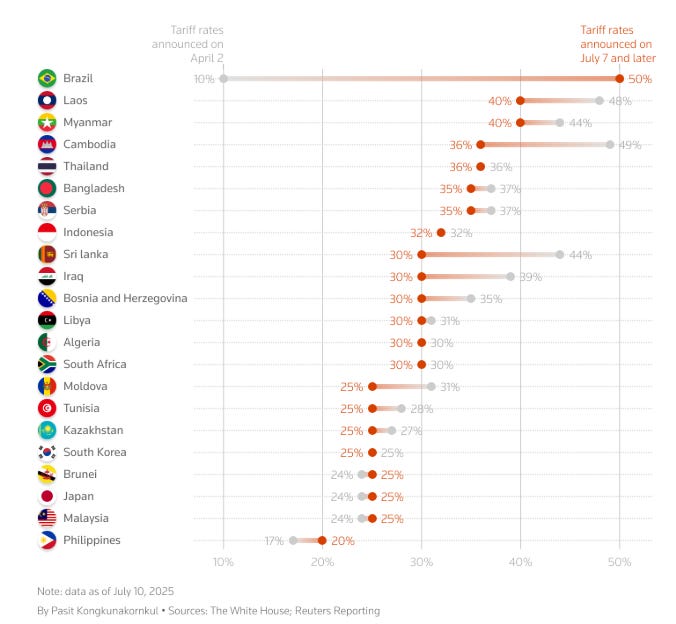
Trump has activated phase two of his tariff offensive, and he’s not letting us rest this summer. This Wednesday, he announced a new 50% tariff on copper imports and an equivalent hike on products from Brazil, both set to take effect on August 1. The measure is based on a national security investigation under Section 232, which classifies copper as a strategic material for semiconductors, defense, batteries, and aviation (though the intended and actual effects are unlikely to align). Meanwhile, Brazil is being punished in retaliation for what Trump calls a witch hunt against Bolsonaro, his ideological ally. We’ve reached a point where it’s no longer clear what the tariffs are aiming to achieve—whether to close a trade deficit (the U.S. actually runs a surplus with Brazil), to raise revenue, or to use them as a political weapon. In fact, Lutnick claimed the April 3 tariffs were the peak, which clearly isn’t true.
Markets, surprisingly, have reacted with restraint, even hitting new highs. The announcement comes at a critical moment: less than three weeks remain before dozens of previously announced tariff hikes come into effect for over 20 countries, including South Korea, Japan, India, and the EU. Negotiations are still ongoing—especially with Europe, where quotas and incentives are being discussed to shield the automotive sector—but room for maneuver is narrowing.
How were the new tariffs communicated? Through generic letters sent to each country, with no opportunity for response… a real circus that highlights the erosion of American diplomacy.

Meanwhile, the Trump administration continues to market tariffs as a direct source of fiscal revenue: $100 billion collected so far, with projections of $300 billion by year’s end, according to the Treasury. The effective tariff rate has climbed to 17.6%, its highest level since 1934.
The market now faces a classic game theory dilemma. Many investors believe the tariffs will be renegotiated or postponed—explaining the apparent calm in stocks and bonds. But if this time there’s no walk-back, no TACO, the adjustment could be abrupt. Especially if new sectors like semiconductors or pharmaceuticals are added, as Trump has promised. In the meantime, the White House is busy posting memes about new market highs. Position accordingly.

The rift between Donald Trump and his biggest campaign donor, Elon Musk, has escalated from a mere disagreement to an open war. The trigger: the approval of the president’s new tax and spending bill—dubbed as such—which Musk deems fiscally suicidal. In response, the billionaire has announced the creation of the America Party, a new political movement aimed at restoring citizens’ freedom and halting the imminent fiscal collapse of the United States.
The party's creation follows an informal poll on Musk’s social network X, where results showed a 2-to-1 majority in favor of breaking the two-party system. The announcement quickly sparked repercussions: Azoria Partners suspended the launch of a Tesla-linked ETF and demanded answers from the company’s board regarding Musk’s priorities after his departure from the Department of Government Efficiency. Investor concerns are clear: political interference could once again distract him from Tesla, just as markets were expecting renewed corporate focus following his exit from government in May. In fact, following recent changes to Grok, the CEO of X also resigned earlier this week.
Tensions have been brewing for some time but intensified after Trump threatened this week to cut off all federal subsidies to Musk’s companies, including EV tax credits and SpaceX contracts. At the same time, Musk has vowed to use his fortune to oust members of Congress who backed the new fiscal package. For Republicans, this fracture poses a strategic threat ahead of the 2026 midterm elections. The former president maintains a steady approval rating above 40%, but Musk’s sudden political entry and his new platform risk splitting the conservative vote at a moment when unity is most needed. The challenge, however, is far from trivial: the two-party system has dominated U.S. politics for over 160 years, and no third party has managed to gain national traction in modern times. The unfolding drama can be tracked through Tesla’s stock chart in recent months.

Bitcoin reached a new all-time high of $118,000, marking a gain of over 25% so far this year. Unlike previous cycles, this rally is being driven by growing institutional demand and crypto-friendly policies adopted by the Trump administration.
The political context has been key: in March, Trump signed an executive order to create a strategic cryptocurrency reserve and appointed pro-crypto figures such as Paul Atkins (new SEC Chair) and David Sacks as head of AI at the White House. In addition, Trump Media & Technology Group is preparing the launch of an ETF that will invest in multiple tokens, including Bitcoin — in other words, the administration is fully backing the sector.
The enthusiasm has extended to other cryptocurrencies as well: Ethereum is now approaching $3,000, its highest level in five months, and many companies are beginning to adopt the same treasury strategy used with BTC for this other crypto asset, which has features that make it particularly attractive — such as the ability to generate yield.

Of course, BTC remains king, and the supply and demand dynamics leave little doubt about the direction the price should take (in fact, we’re going to add these fundamental tracking metrics to our monitors). In the last two days alone, we’ve seen inflows of over $1B into ETFs — which is enormous considering that only ~900 BTC are mined each day, equivalent to $100M (institutional demand = 10x new daily supply).

Higher.
The copper market enters the second half of 2025 in the midst of a historic rally, driven by a mix of trade détente and physical supply tension. In May, tariff relief between the U.S. and China — with a mutual 115% rollback and a 90-day truce on new measures — reignited risk appetite and strengthened the structural bullish case for the metal, tied to the growth of data centers, emerging urbanization, and the electrification of critical infrastructure. However, China’s real estate sector remains the main drag — the elephant in the room. Still, the most relevant driver of this rally hasn't been political, but geological.
Supply is under constant pressure. The case of Ivanhoe in Kakula — which cut its 2025 guidance by ~25% after flooding in the DRC — shows just how fragile the system is: inventories cover barely six days of demand, and disruptions historically affect 4% to 5% of global supply each year. On top of that, there's a structural lag: it takes more than 17 years, on average, to bring a new mine online from discovery.

One particularly troubling sign is the inversion of Treatment Charges (TCs), which have turned negative. In practical terms, this means smelters are paying miners to receive concentrate — a reflection of an acute feedstock shortage and overcapacity at smelting facilities. This phenomenon has only been seen in exceptional moments — such as at the height of the pandemic — and typically signals tighter balances and sustained price increases.

With copper nearing the $10,000-per-ton mark (already surpassed in New York, while still approaching in the LME), the market is now waiting for a catalyst to trigger a technical breakout — the Section 232 tariff review in the U.S. could be it. Meanwhile, another anomaly is surfacing: the “trapped copper” in the U.S., stockpiled as a hedge against potential tariffs, which cannot be re-exported without incurring massive local premiums — a scenario that hardly fits Trump’s ambitions to revive U.S. manufacturing.

If there’s one metal where the macro narrative and physical reality align most clearly, it’s this one.
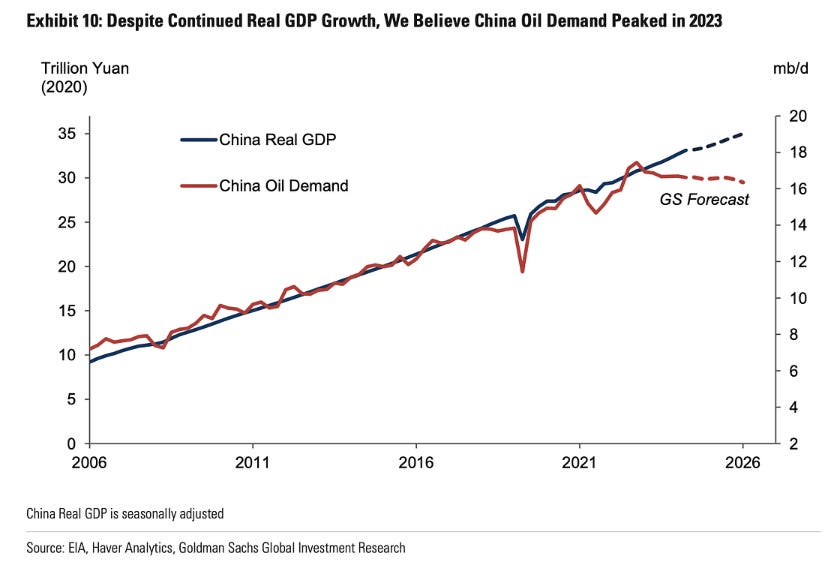
After the July OPEC+ meeting, the 2.2 million barrels per day of voluntary production cuts will be fully phased out, leaving Saudi Arabia as the only significant player with real adjustment capacity. On the downside, analysts have reasons to believe that global crude inventories could surge with this production increase, as on paper, the voluntary cut has been the main factor holding up oil prices — its removal should therefore imply downward pressure, especially if, as many argue, Chinese demand has already peaked.

But sometimes first-order thinking is misleading, and the resilience of prices, timespreads, and refining margins seem to contradict it. So why are prices rising if OPEC+ is ramping up production? Because, in reality, there was never a cohesive cut. Cheating and overproduction within the group have been evident to anyone tracking export data. Real control doesn’t lie in collective decisions but in Saudi Arabia’s ability to adjust supply at will. And if the market perceives that, despite the announcements, effective supply isn't increasing, prices will continue to climb. Right now, KSA is the new sheriff in town.

This is what must happen for the bullish scenario to hold:
Global inventories must not rise significantly. If they do, the bearish consensus view will be validated.
U.S. shale production cannot remain flat — it needs to decline by year-end.
Saudi Arabia must keep crude exports low, even if partial production increases are announced. That’s the only way to maintain the perception of market control.
Chinese demand must grow, not contract as the market suggests, and it must surpass the supposed “peak” that many are already pricing in.
Of these, shale is the easiest to monitor — and its decline already appears irreversible: steep decline rates, best wells already drilled, depleted inventories, and low prices that don't incentivize new investment. All basins, in fact, are behaving the same way. And as explained in the book Twilight in the Desert, even in Saudi Arabia — where reserves seem endless (which is partly the intention, given the secrecy surrounding the country’s real resources) — ARAMCO’s CEO admitted that their fields decline at a rate of 5.5% annually. Got offshore?


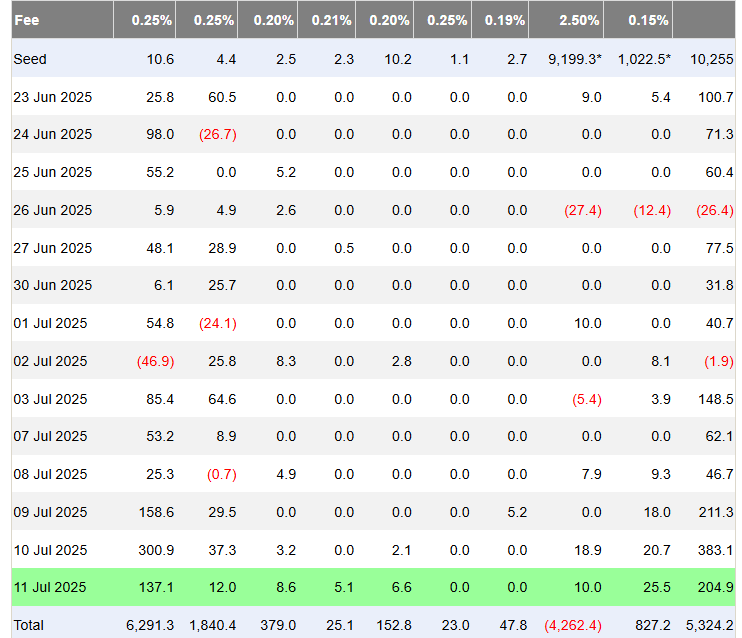


Model Portfolio
The model portfolio's return is +11.09% YTD compared to +6.67% for the S&P500 (our portfolio mesured in € terms, which is weighting -12% in our portfolio this year vs the S&P in $), and +86.2% versus +54.2% for the S&P500 since inception (September 2022). The model portfolio, as of Friday's close, is as follows:
Keep reading with a 7-day free trial
Subscribe to LWS Financial Research to keep reading this post and get 7 days of free access to the full post archives.