


Weekly summary 15/06
Ice cold CPI

Disclaimer
LWS Financial Research is NOT a financial advisory service, nor is its author qualified to offer such services.
All content on this website and publications, as well as all communications from the author, are for educational and entertainment purposes only and under no circumstances, express or implied, should be considered financial, legal, or any other type of advice. Each individual should carry out their own analysis and make their own investment decisions.
Weekly macro summary
There have been quite a few interesting events to analyze this week, and below I list the most noteworthy news. Let's get started:
After three days of negotiations in London, Trump has announced a new framework agreement to revive the fragile trade truce with China. According to the U.S. president, the deal —still pending approval by both him and President Xi Jinping— sets a 55% tariff on Chinese imports and lifts China’s export restrictions on rare earths and other critical materials. In return, the U.S. will once again allow Chinese students to enroll in American universities.
That 55% isn’t a new standalone tariff, but rather the result of layered measures: a base 10% “reciprocal” tariff applied to all U.S. trade partners by Trump, an additional 20% linked to fentanyl trafficking, and a 25% tariff inherited from his first term. This composite structure illustrates how Trump’s trade policy remains deeply intertwined with broader strategic interests —national security, immigration policy, educational diplomacy, and technological dominance.
The key for the U.S. appears to lie in securing rare earth supplies —essential for industries like defense, renewable energy, and microelectronics— while restricting the export of sensitive technologies to China, such as chip design software or aerospace components. This reflects rising tensions in the tech race. Although the market hasn’t reacted strongly yet (partly due to the lack of specific details and partly because it mirrors a similar deal struck in Switzerland), the agreement may help prevent an immediate tariff escalation. Had no deal been reached, tariffs would have returned in August to extreme levels: 30% to 145% in the U.S. and 10% to 125% in China.
In short, the deal is more of a tactical pause than a structural fix. Trump and Bessent had promised “90 deals in 90 days,” but so far only one has materialized —with the UK, and even that one was largely symbolic— and no others seem close to being finalized.
Platinum and palladium prices have surged sharply this month, reaching highs not seen in over four and seven years, respectively. However, consensus and analysts remain unconvinced, leaning on the narrative of internal combustion engine (ICE) vehicles being replaced by EVs. Within the group of precious metals itself, palladium is even more out of favor, as nearly 90% of its demand comes from gasoline vehicle catalytic converters. This makes it particularly vulnerable to the rise of electric vehicles, which are rapidly displacing such engines —especially in China, where sales of electric and plug-in hybrid cars grew 32% year-over-year in April.
Platinum, by contrast, is more diversified. In addition to its use in diesel catalytic converters, it has applications in industry, jewelry, and emerging technologies such as hydrogen. This gives it greater resilience in the face of the energy transition, especially since heavy commercial vehicles —which will electrify more slowly— will continue to rely on platinum in the coming years.
Meanwhile, inventories are at rock bottom, with no new projects in sight. Above-ground stockpiles are near historic lows. The market’s structural deficit continues to deplete the remaining inventories, and there are no major new mining projects on the horizon —reinforcing the scarcity narrative and limiting the supply side's ability to respond.

Chilly CPI report from the United States. Inflation in the U.S. came in below expectations, giving new momentum to the rate-cut narrative. Headline CPI rose just 0.1% month-over-month, compared to the expected 0.2%, and core CPI also surprised to the downside: 0.1% vs. 0.3% forecast. On a year-over-year basis, headline inflation remains at 2.4%, in line with estimates, but the core reading fell to 2.8%, below the projected 2.9%.

In detail, prices continue to fall in key segments such as new and used vehicles and apparel, while food rose by +0.3%, likely due to the recent weakness in the dollar and its impact on imported goods. Housing —which accounts for more than a third of the index— continues to lose steam in year-over-year terms, though it still weighs heavily on the aggregate figure.
In this context, and without the pressure of new tariffs from the Biden administration (or a potential surge if Trump returns), the Fed would have already started cutting rates. The problem now is more geopolitical than economic: prices are under control, but trade policy and fiscal risk keep the Federal Reserve on edge.
On the other side of the world —and the geopolitical chessboard— China continues to flirt with deflation, with a new report showing both PPI and CPI posting negative figures. It's likely we'll see a new round of stimulus sooner rather than later to counter this trend and attempt to return the country to a growth path vital for its political and social stability.

Though expectation surveys should be taken with caution, the New York Fed’s May data show a clear trend: U.S. households’ anxiety over future inflation continues to ease. Across all time horizons —short, medium, and long term— inflation expectations have declined. Five years out, consumers now expect inflation at 2.6%, just below April’s 2.7%, though still above the Fed’s official 2% target.
Financial markets show similar, though slightly more subdued, signals. Five-year breakevens —the spread between nominal and inflation-protected bonds— hover around 2.35%, and five-year inflation swaps sit at 2.45%. The Fed, as usual, lags well behind the curve.
The EIA has released its June forecast, and the message is clear—though likely flawed. It expects a significant drop in Brent crude prices, down to levels near $60/barrel by the end of 2025, with an average of just $59/barrel in 2026. If this low-price scenario materializes, it will have serious implications for the U.S. energy sector and the arrival of new supply.
U.S. crude production, which hit a record 13.5 million barrels/day in Q2 2025, is expected to begin declining. The EIA projects an average of 13.4 million for this year, falling slightly in 2026. Margin pressure and reduced CAPEX will likely limit new projects. Retail gasoline prices are also expected to decrease.
Altogether, the message is twofold: U.S. oil supply has likely peaked this cycle, and the price environment offers no clear incentive to increase output in the short term. This could reinforce OPEC+’s role in balancing the global market in the coming quarters.

Looking at the real data, it’s already clear that U.S. crude production has started to decline. According to HFI Research, which uses real-time estimates, April closed with effective output at 13.134 million barrels/day. However, the official EIA figure —adjusted for a historical downward bias of ~300,000 b/d— may be reported around 13.25 million. It’s worth noting that roughly 290,000 b/d of condensates are excluded from the official crude production number, further lowering the real operating figure. For May, HFI projects an average of 13.235 million, but with effective production closer to 12.95 million. The latest implied data even suggests a drop to 12.8 million, indicating the decline has only just begun.
The “record production” narrative is starting to fade just as oil prices face downward pressure and shale investment retreats. If this trend is confirmed, supply adjustments could arrive sooner than official models anticipate.

Logic and intuition align this time: it shouldn’t surprise anyone that U.S. crude production is beginning to fall, as data already show significant cuts in both the active rig count and the number of frac spreads, clear signs that shale producers are dialing back operations.
This isn’t just a direct response to tighter margins and weaker oil prices—it also reflects a more disciplined strategy focused on profitability over volume. The industry is no longer blindly chasing production records; the focus has shifted to maintaining cash flow and reducing leverage. If this dynamic continues, the lagged effects of operational cutbacks will eventually result in a more visible production decline—just as the market begins to realize the supply glut may not be as structural as it once seemed.

If U.S. crude production drops to around 12.5–12.6 million barrels/day by year-end, the gap with consensus estimates will be roughly 1 million b/d. That would dismantle much of the surplus narrative many anticipate for 2026, with significant implications for the oversupply story that has weighed on the market.
Meanwhile, inventories continue to tighten: combined stockpiles among the “Big 4” are about 44 million barrels below last year’s level, creating upward pressure on WTI timespreads. The curve has tightened—a clear sign of short-term scarcity in the physical market.
At the same time, Reuters data show that five OPEC+ countries that committed to boosting output in May only delivered 180,000 b/d, well short of the promised 310,000 b/d. This reinforces what many have long suspected: not all announced increases materialize, and OPEC+’s “return of oil” mostly existed in spreadsheets and press releases.

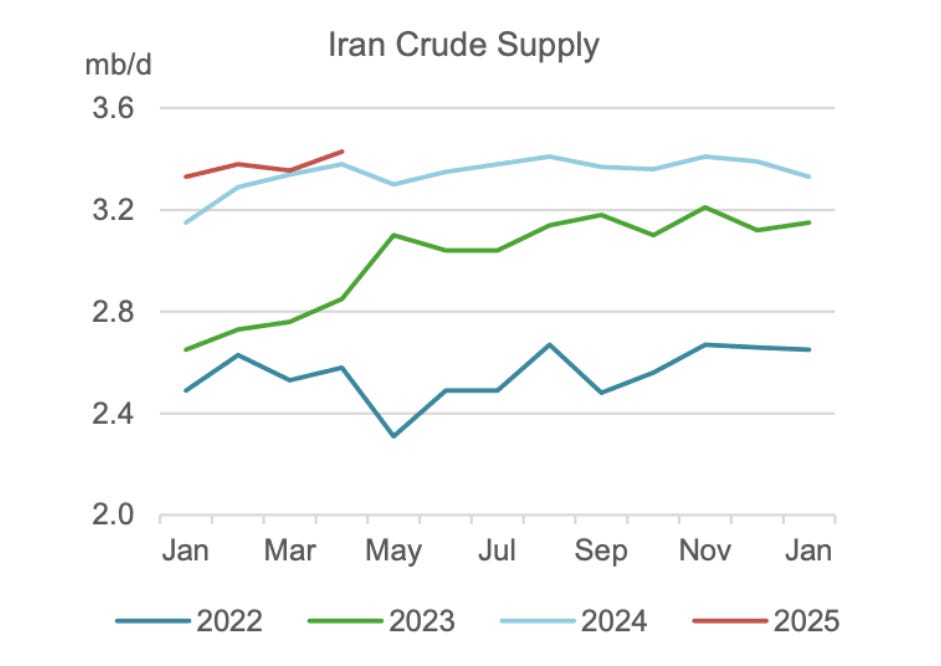
Meanwhile, tensions are flaring up again in the Middle East — and this time, it seems serious. On Thursday, Israel attacked some Iranian leaders and nuclear infrastructure, aiming to derail the Persian country’s nuclear ambitions amid the stalled and likely failed negotiations with the United States. Although Iran has vowed to retaliate, its military infrastructure has been severely compromised, and it doesn't appear this will be a fight between equals. The Israeli government has already signaled that the operation will likely extend for a couple of weeks. How does this affect us (focusing on the economic and market aspects, beyond the humanitarian dimension)?
Iran is a major oil producer, with output close to 3.3 million barrels per day, so any disruption — either to its production or to the routes it uses (shared with the Saudis, such as the Strait of Hormuz) — would have a massive impact. Just the threat of such a loss (when production is already maxed out and downside risks dominate) was enough to push crude oil to $75/bbl on Friday.

In general, these rules help quickly assess potential scenarios:
Hostilities end quickly and Iran responds in a restrained manner (this no longer seems likely after Friday's attacks on civilian targets in Tel Aviv) → Part of the price spike will correct, and we may slowly see oil fall back toward ~$70/bbl.
Israel attacks energy infrastructure (likely refining only, not production, to avoid intervention from China or the U.S.) or the conflict drags on → A range of $75–$80/bbl is reasonable.
Closure of the Strait of Hormuz (in my view, virtually impossible to execute and even less likely to sustain) → Oil prices >$100–$120/bbl within days.


Model Portfolio
The model portfolio's return is +4.69% YTD compared to +1.62% for the S&P500 (our portfolio mesured in € terms, which is weighting -10% in our portfolio this year vs the S&P in $), and +75.4% versus +46.9% for the S&P500 since inception (September 2022). The model portfolio, as of Friday's close, is as follows:
Keep reading with a 7-day free trial
Subscribe to LWS Financial Research to keep reading this post and get 7 days of free access to the full post archives.