Disclaimer
LWS Financial Research is NOT a financial advisory service, nor is its author qualified to offer such services.
All content on this website and publications, as well as all communications from the author, are for educational and entertainment purposes only and under no circumstances, express or implied, should be considered financial, legal, or any other type of advice. Each individual should carry out their own analysis and make their own investment decisions.
Weekly macro summary
There have been quite a few interesting events to analyze this week, and below I list the most noteworthy news. Let's get started:
Powell, in his Wednesday speech, did little to calm market fears or signal a dovish stance. He made it clear that the Federal Reserve has no intention of taking action until there is greater clarity about the direction of the economy. But what truly unsettled the market wasn’t the wait—it was his explicit warning: Trump’s tariffs are simultaneously pushing inflation higher and growth lower, which could push the Fed even further away from its two main objectives—full employment and stable 2% inflation. The message was blunt: if tariffs continue to escalate, we could see a deadly mix of slower growth and higher inflation—precisely the scenario in which the Fed has the least room to maneuver. And the market noticed. Indices extended their losses after his speech, partly because Powell struck a more hawkish tone than expected, rejecting the idea of a “Fed put” and confirming that markets must adapt to this new regime of political volatility without expecting automatic bailouts. Trump wasted no time in lashing out at Powell, saying he’s looking forward to the end of his term (mid-next year). If the situation escalates and Powell ends up “open to work” ahead of schedule, it would be a massive red flag for legal certainty in the U.S. as an investment destination.
His analysis of the current situation was also striking: the U.S. started the year with full employment and falling inflation expectations, but unilateral decisions on trade policy are derailing that path. Powell acknowledged that tariffs are already driving short-term inflation expectations higher, and that the full impact is still uncertain. If these shocks end up feeding into final prices and become entrenched in long-term expectations, the Fed would be forced to act.
In the background, the Fed is facing an increasingly uncomfortable position: caught between a labor market that may begin to deteriorate and persistent inflationary pressures. For now, growth is slowing, consumption is cooling, and business confidence is falling—all amplified by the noise of the trade war. But until there is greater visibility on the duration and scope of the tariffs, the Fed has no intention of changing course. In the market, the takeaway is already clear: the rate-cutting cycle is still in motion—but now with more urgency. Expectations for four rate cuts in 2025 have gained traction following Powell’s speech. And in the meantime, investors understand that volatility is here to stay.
Nvidia took a heavy blow this week after confirming it will take a $5.5 billion accounting charge linked to the export ban of its H20 chip to China—its flagship product in the Chinese market. The announcement comes after the U.S. government determined that even this scaled-down version of the chip—specifically designed to circumvent earlier restrictions—is still too powerful for potential use in supercomputing, thus triggering Commerce Department controls.
The impact goes beyond the balance sheet. The H20 was Nvidia’s pathway to remain involved in China’s AI boom, with giants like Tencent, Alibaba, and ByteDance placing massive orders due to the explosive demand for inference chips—the response phase of already trained models, which is becoming increasingly relevant in the market. The Trump administration’s decision means that, unless specific licenses are granted (which remains highly uncertain), Nvidia is now effectively blocked from a key market. The official argument is that, while the H20 has lower computational power than its more advanced siblings, it retains high-speed connectivity with memory chips and other coprocessors—potentially enabling its integration into supercomputing systems. All this comes just as Nvidia announced a joint investment with TSMC to build AI servers worth up to $500 billion in the U.S., aligning with the Trump administration’s reindustrialization goals. A convenient form of compensation. But the paradox is stark: while the company bets on relocating part of its value chain, it is simultaneously being shut out of one of its biggest growth markets.
For Nvidia, the risk isn’t just financial—it’s strategic. Without a regulatory or technical workaround, the door opens for an acceleration of domestic substitution in China—where Huawei and other players are already working on homegrown alternatives—and weakens the narrative of Nvidia’s inevitable global leadership in AI. The message behind this decision is crystal clear: chips are no longer just hardware—they are pure geopolitics.
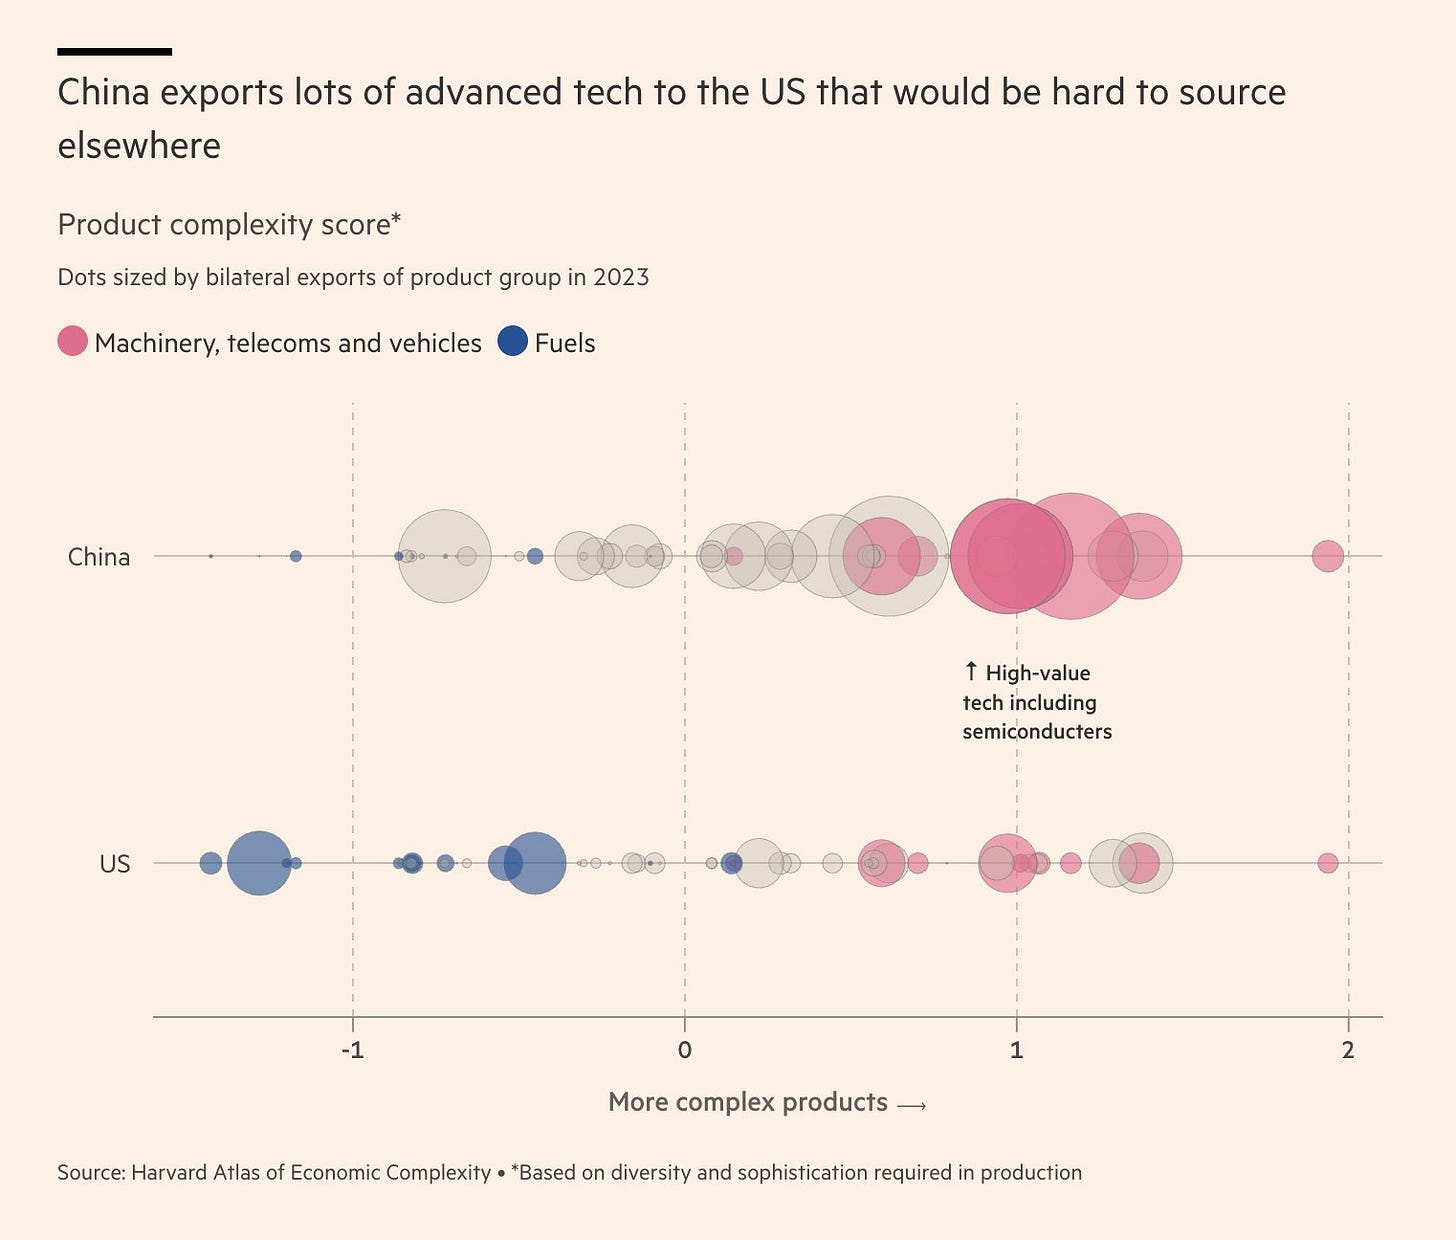
The back-and-forth between China and the United States in their ongoing trade war continues, with increasingly exaggerated announcements regarding tariffs (some products are already at 245%, though in practice, trade has largely come to a standstill). This week, the Trump administration has held meetings with its Japanese and European counterparts (via Giorgia Meloni), and it seems that agreements with these two parties are progressing, even if public statements still show some skepticism. Based on leaks so far, the U.S. appears more focused on removing non-tariff barriers (regulations, standards, etc.) than merely reducing the trade deficit. Meanwhile, China is making efforts in the ASEAN region to strengthen its trade relationships there. And it's in a stronger position: if we look at what it imports from and exports to the U.S., it generally exports high-complexity, high-value-added goods and imports the opposite—making supply restructuring and substitution far easier for them.
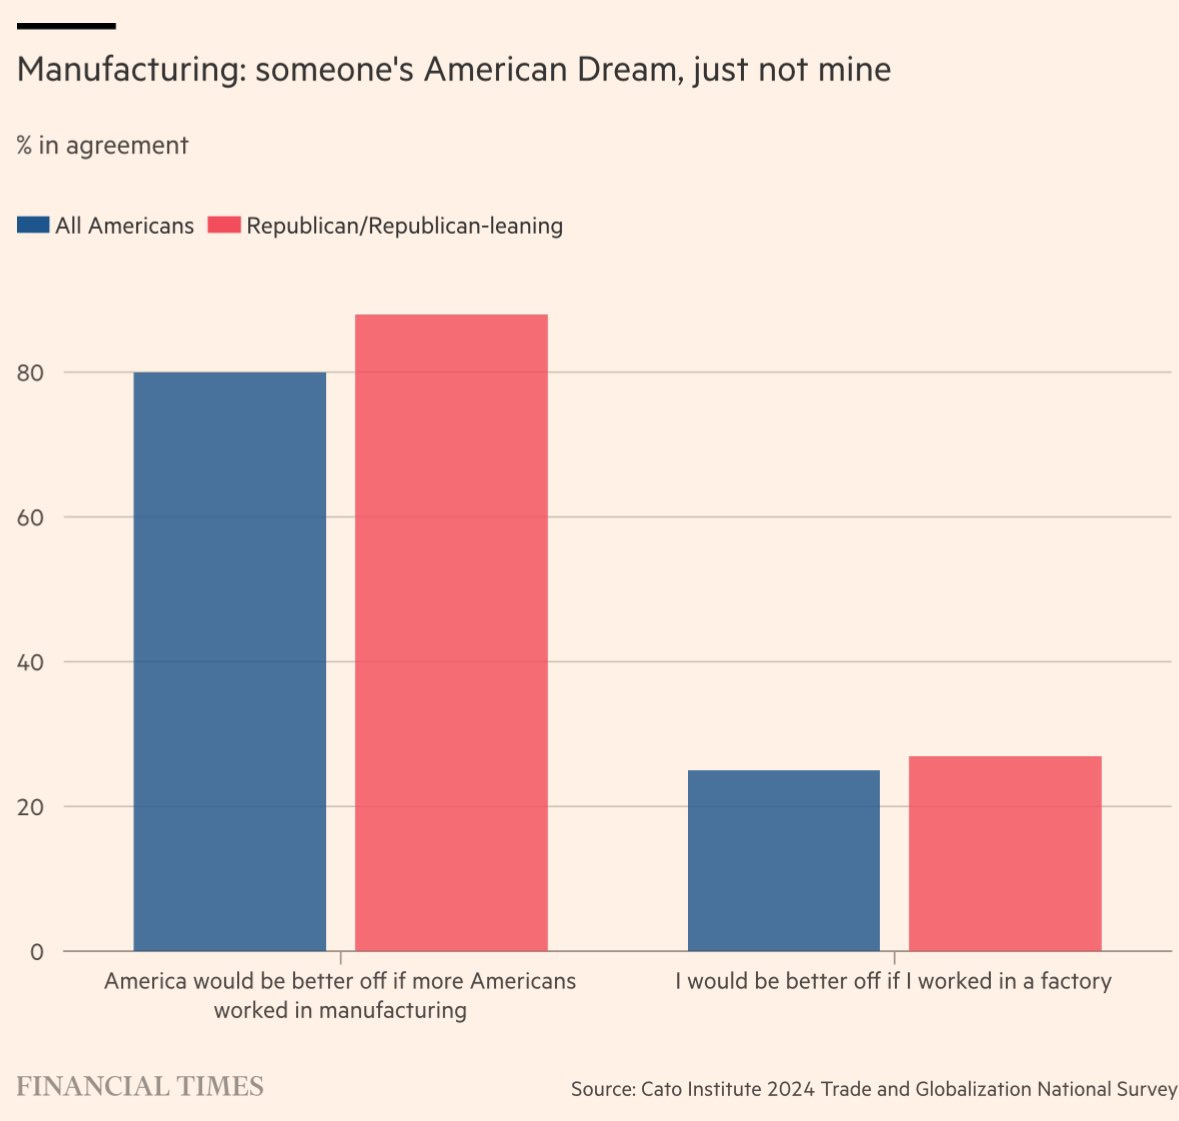
In fact, Trump’s worldview is anchored in a vision of a society that no longer exists. The following chart is very telling: 80% of Americans believe the country would be better off if manufacturing had a greater role in the economy, but only 22% of respondents would want to work in that sector. Preaching what they wouldn’t practice.
The reality is that the escalation has been far quicker and more damaging than the Trump administration initially expected, and they are now eager to strike a deal that allows them to save face and stabilize the situation. But convincing Xi to let them walk away unscathed from such a tight spot will be a tough sell.
We've had two extraordinary years in terms of capital flows directed toward gold purchases. Specifically, since the onset of the war in Ukraine and the freezing of Russian assets by the West, central banks have taken note and significantly increased their reserves. This has, in fact, been the driving force behind the entire gold rally, as speculators have continued selling paper assets (as evidenced by the decline in ETF holdings). Far from slowing down, the trend appears to be accelerating. Early 2025 is setting a new record, with $80 billion in net inflows during the first quarter alone—something that becomes less surprising when placed in the context of today’s climate of uncertainty.
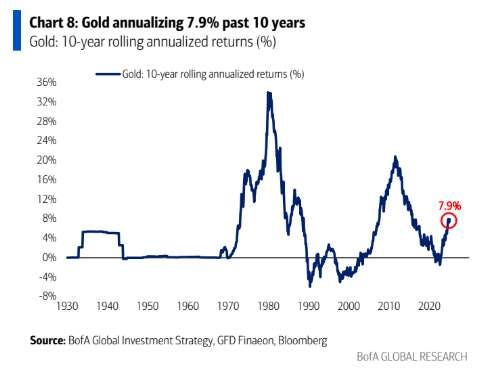
The following chart strikes me as particularly interesting, as it highlights two key aspects of investing in gold (or gold-related companies):
It's very hard to lose money in the long run. Looking at the chart, we see that there are very few 10-year periods with negative returns, and those tend to be corrected swiftly and sharply.
It’s a clearly cyclical investment. Strong revaluations over short periods lead to extraordinary returns concentrated in just a few years, followed by a valley of sentiment and prices.
We are halfway through a major bull market in gold, and the only problem is that (this time) everyone seems to know it. Going long gold has become the most consensus trade right now. As the old Rockefeller legend goes:
When the shoeshine boy is investing in the stock market, I sell everything.
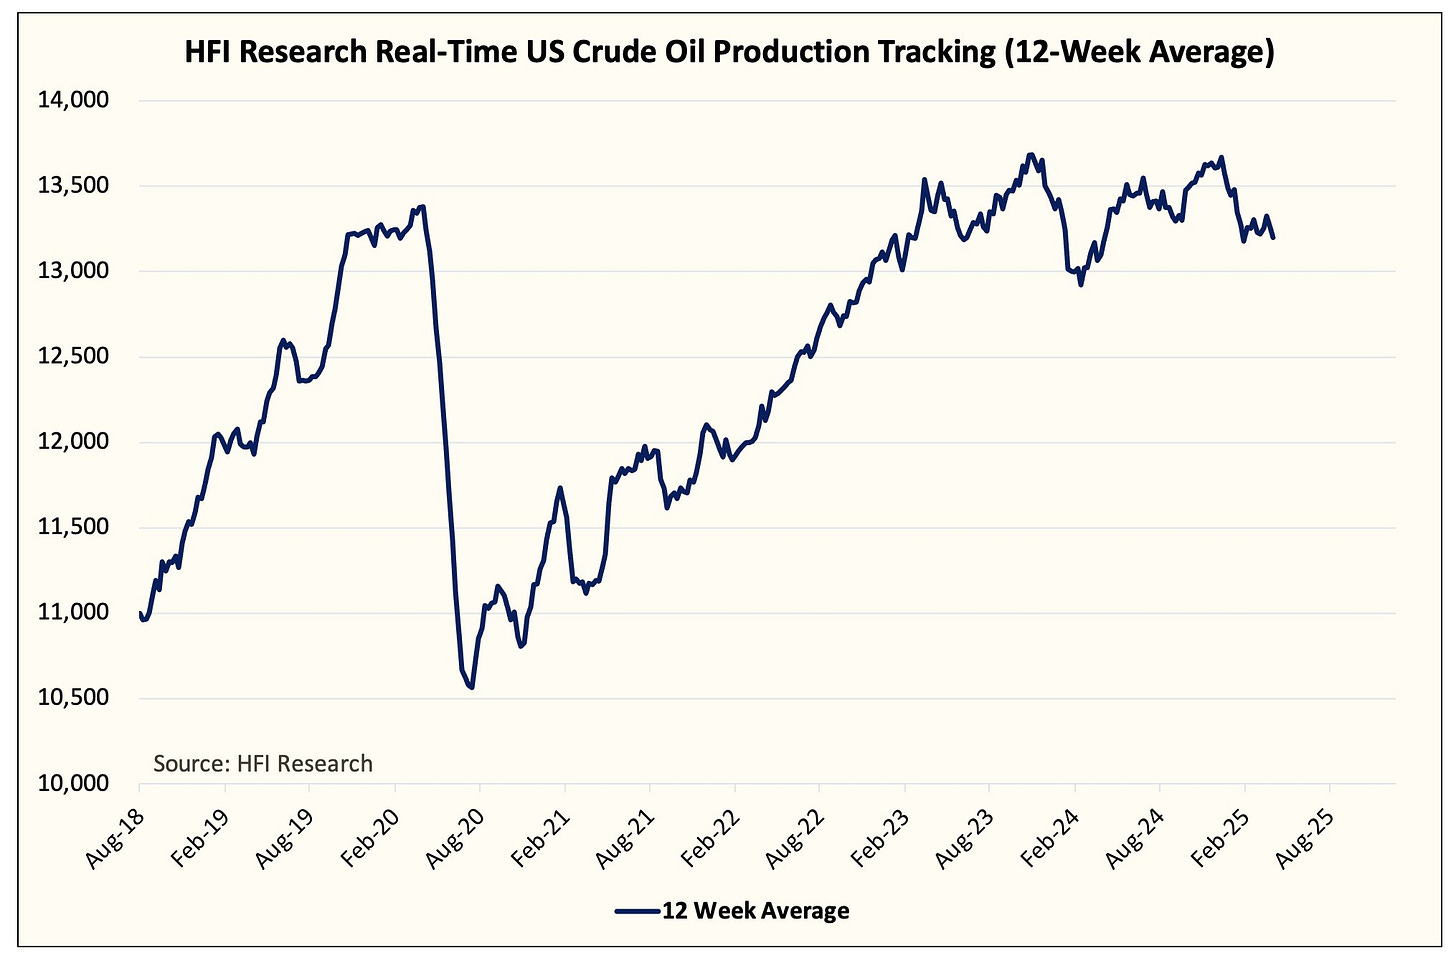
The latest inventory and production data confirm what some already suspected: actual shale production in the U.S. is falling short of estimates—and let’s not even talk about the illusion of growth. Based on these inventory figures, implied production is around 12.7 million barrels per day, well below the ~13M b/d that many models still use. It's not a collapse, but it is a clear shift that sends a message: at $70/bbl, the industry had room to sustain activity levels, but with WTI flirting with $62, the profitability-inventory equation turns negative. In this environment, oil companies not only have justification to pause activity, but also real incentives to do so. Preserving high-quality inventory becomes more strategically valuable than maintaining production with tight margins.
This production decline has two complementary readings: on the one hand, it sets the stage for a new wave of sector consolidation. Companies with strong balance sheets will have free rein to acquire assets from weaker operators, often below PDP value, offsetting execution risk and uncertainty over unproven reserves with a discount. The net result: less investment, more discipline, and a lower production floor than was expected just a few months ago.
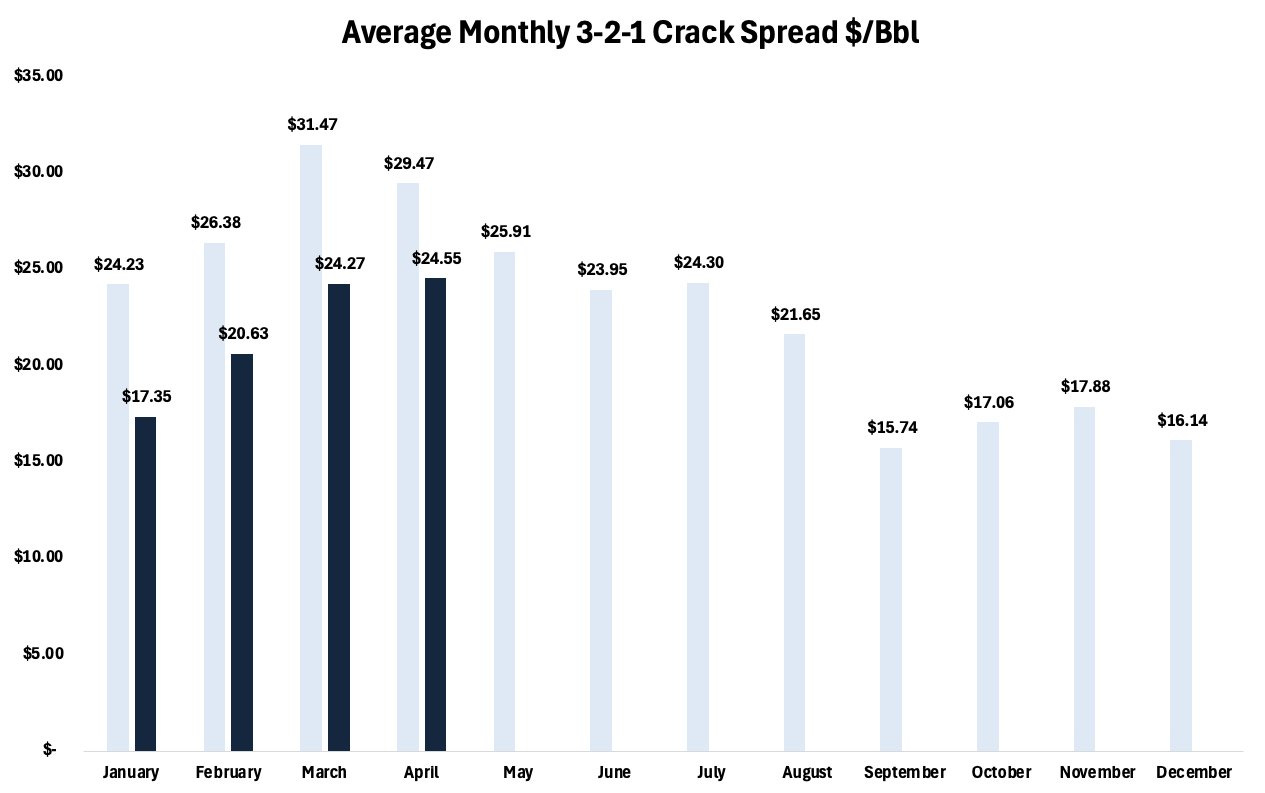
Despite the weak price—surprising in itself amid renewed geopolitical risk with Iran—key physical demand indicators (timespreads and refining margins) remain strong, even trending upwards in recent weeks.
The EIA continues in its fantasy scenario and, despite net inventory draws in Q1, they report a 1Mb/d surplus for the period and expect it to continue over time.
Meanwhile, OPEC also seems disconnected from the macro updates we’re seeing: they forecast a 1Mb/d deficit for this year, which may have made sense before the onset of the war and rising trade threats, but seems increasingly unrealistic at this point.
Model Portfolio
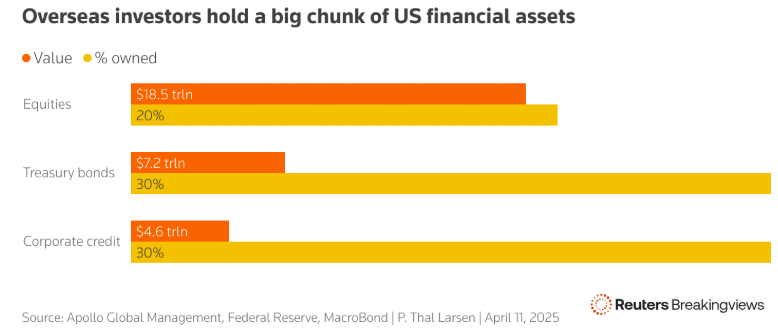
This week I read an interesting perspective (Dario Perkins, TS Lombard), which puts numbers to a phenomenon we had all sensed: since 2012, the world has accumulated exposure to U.S. equities close to $14 trillion, half of which comes from Europe. In other words, the Old Continent has bet more on Wall Street than on its own business fabric (that figure exceeds the entire market capitalization of the Euro Stoxx 50).
The data is revealing for several reasons. First, it highlights the extent to which the U.S. market has become the de facto safe haven for global capital, even in cycles where fundamentals alone no longer justify it. Second, it implies that any dislocation in the Fed’s monetary policy has automatic and disproportionate implications for the financial wealth of non-U.S. actors. And third, it raises an uncomfortable question: what would happen if that capital decides to come back home?
The “there is no alternative” narrative regarding the U.S. has been a structural anchor for investment flows over the past decade. But if a higher-for-longer interest rate environment takes hold, with reduced economic exceptionalism and increased political volatility, that anchor weakens. And with $7 trillion in European investments across the Atlantic, the impact would be far more than symbolic.
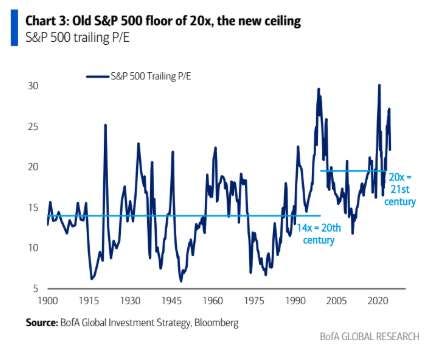
Beyond being an extraordinary decade for corporate earnings, the last 10 years have been marked by a major multiple expansion, stretching valuations to a very demanding level; with the current correction, no matter how abrupt and severe it may seem, we are still at levels far above the historical average, which makes it important to contextualize where we stand. This environment, as we have said many times before, is ideal for stock picking.
The model portfolio's return is -11.94% YTD compared to -9.91% for the S&P500 (in $ terms, which is weighting -8% in our portfolio this year), and +47.6% versus +30.3% for the S&P500 since inception (September 2022). The model portfolio, as of Friday's close, is as follows:
Keep reading with a 7-day free trial
Subscribe to LWS Financial Research to keep reading this post and get 7 days of free access to the full post archives.


