

Disclaimer
LWS Financial Research is NOT a financial advisory service, nor is its author qualified to offer such services.
All content on this website and publications, as well as all communications from the author, are for educational and entertainment purposes only and under no circumstances, express or implied, should be considered financial, legal, or any other type of advice. Each individual should carry out their own analysis and make their own investment decisions.
Weekly macro summary
There have been quite a few interesting events to analyze this week, and below I list the most noteworthy news. Let’s get started:
US inflation slowed more sharply than expected in June, although the reading is far from a definitive victory for the Federal Reserve. The CPI fell 0.4% month over month—its first decline since April 2020—and eased to 3.5% year over year, down from 4.2% in May. Core inflation also provided some relief, rising 2.6% year over year while remaining flat on a monthly basis.
At first glance, the data looks clearly dovish. The problem is that much of the improvement came from energy, where prices fell 5.7% during the month, with gasoline plunging by almost 10%. This decline reflected the temporary truce between the United States and Iran, but the backdrop has already changed. The resumption of attacks in the Strait of Hormuz, the new naval blockade, and the rebound in oil prices make it likely that much of this relief will disappear in July.
In other words, the June report is backward-looking. Inflation improved because energy prices fell, but the main catalyst behind that decline has already reversed. If crude oil and gasoline continue to rise, the impact will eventually feed through not only to the energy component, but also to core inflation through transportation, logistics, and production costs. For now, the market expects the Fed to keep interest rates unchanged in the 3.50%–3.75% range at its next meeting, although it is still pricing in close to a 60% probability of a rate hike in September. Kevin Warsh reinforced this interpretation by insisting that the central bank will not tolerate persistently elevated inflation.
There were also positive signals in services and housing. Owners’ equivalent rent increased by just 0.2%, shelter recorded its smallest monthly rise since 2021, and healthcare prices declined slightly. Core goods prices fell for a second consecutive month, which could suggest that the pass-through from tariffs to consumer prices is losing momentum. However, there are still reasons to remain cautious. Part of the weakness came from volatile or potentially unsustainable components, such as motor vehicle insurance, tobacco, and certain medical services. In addition, estimates suggest that core PCE inflation may still have risen by around 3.3% year over year in June, well above the Fed’s 2% target.
Overall, the report represents tactical relief for the Fed, not evidence that the inflation problem has been resolved. Core inflation is cooling, but the energy shock is once again moving to the forefront and threatens to reignite price pressures in the coming months. While the market debates whether June marks the beginning of a broader trend, geopolitics is once again reminding investors that energy-driven disinflation can disappear just as quickly as it arrived.
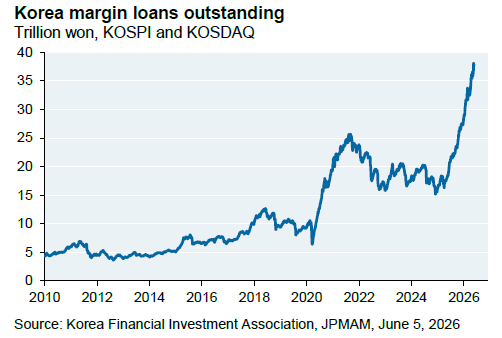
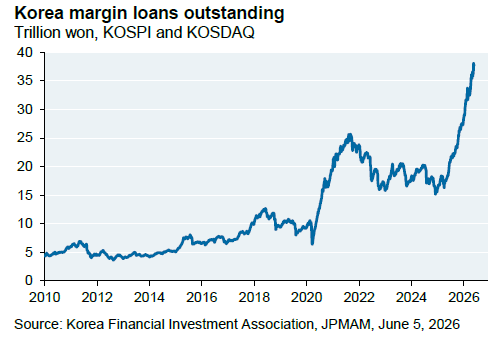
South Korea is beginning to display some of the classic signs of a market dominated by retail leverage. Margin loans against KOSPI and KOSDAQ stocks have surpassed 35 trillion won, well above the peaks reached during the previous speculative cycle in 2021. The increase has been particularly steep throughout 2026, suggesting that a growing share of the rally was supported not only by fundamentals or long-term capital flows, but also by debt.
The consequences have emerged during the recent correction. Sharp declines in leveraged products have caused massive losses and forced regulators to call an emergency meeting. What is most concerning is the profile of those affected: investors aged between 20 and 39 account for 62% of the accounts that were effectively wiped out. In other words, the group with the least experience and probably the lowest level of personal wealth assumed the largest share of the risk. In fact, it is estimated that one in every 30 South Koreans has received a margin call this month.
This is not a problem unique to South Korea, but another example of how the democratisation of market access has also democratised leverage. When markets rise, margin amplifies returns and reinforces the perception that risk has disappeared. When the market turns, the opposite occurs, with forced selling, liquidations, and further downward pressure on prices. The chart does not necessarily signal an immediate market top, but it does reveal a much more fragile market structure. The greater the proportion of borrowed money, the less it takes to turn a normal correction into a violent deleveraging event. And, as is often the case, those who arrive last at the party are also the ones who end up paying most of the bill.
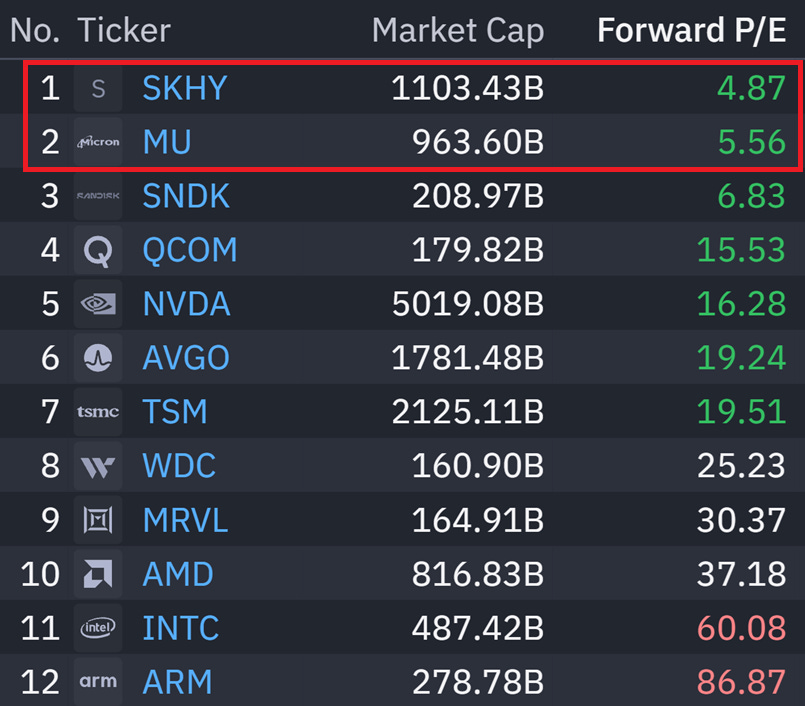
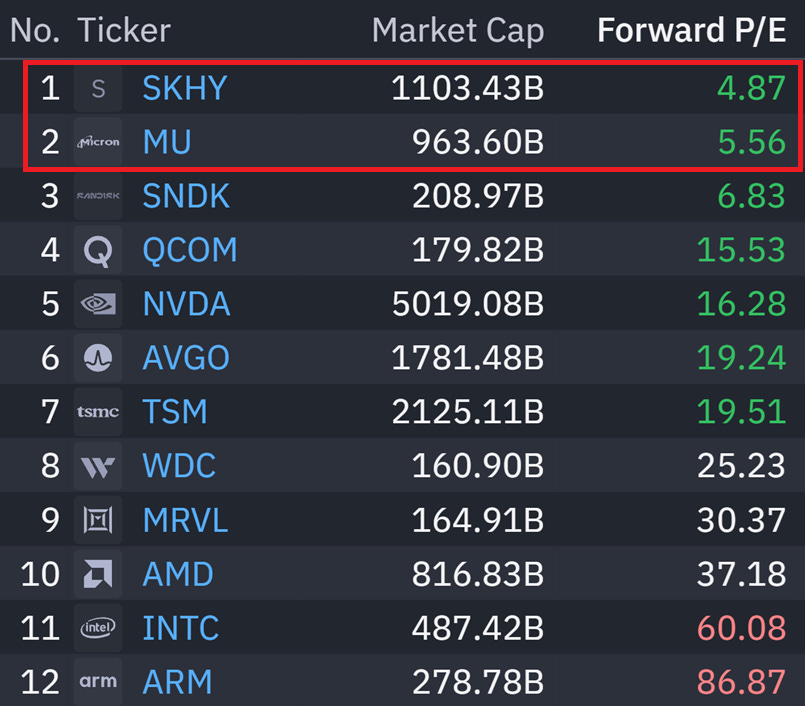
In fact, much of the problem stems from a failure to understand the capital cycle, into which semiconductor companies fit perfectly. In recent weeks, a table like the one attached has become increasingly popular, showing how optically “cheap” the leading memory-chip companies appear, despite some of them having risen close to 1,000% this year. What this interpretation fails to capture are the real implications of that apparent bargain. At the peak of the cycle, when memory is in short supply and prices are artificially elevated, earnings surge. However, new capacity is already being built and is expected to bring this period of extraordinary margins to an end. Of course, it remains to be seen whether the next cyclical trough will be higher than the previous one and whether profitability will stabilise at more constructive levels. But buying cyclical companies when they appear cheapest is a strategy that has rarely worked.
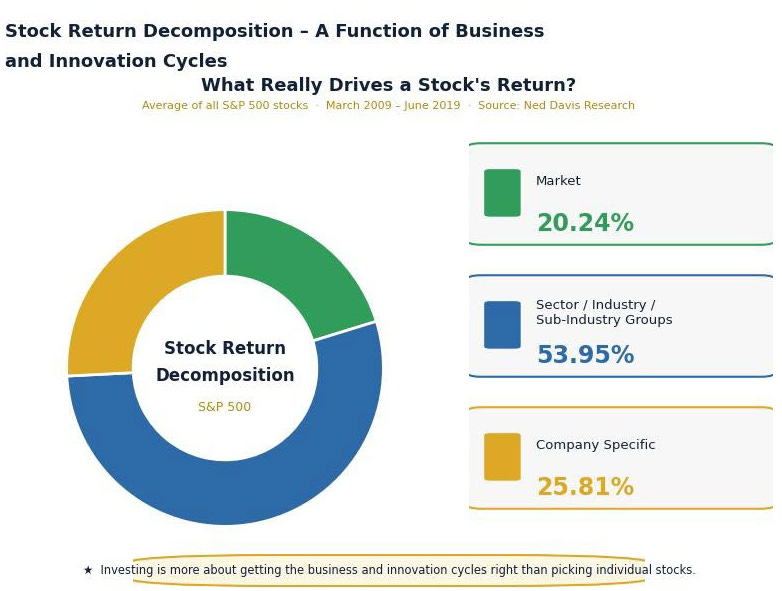
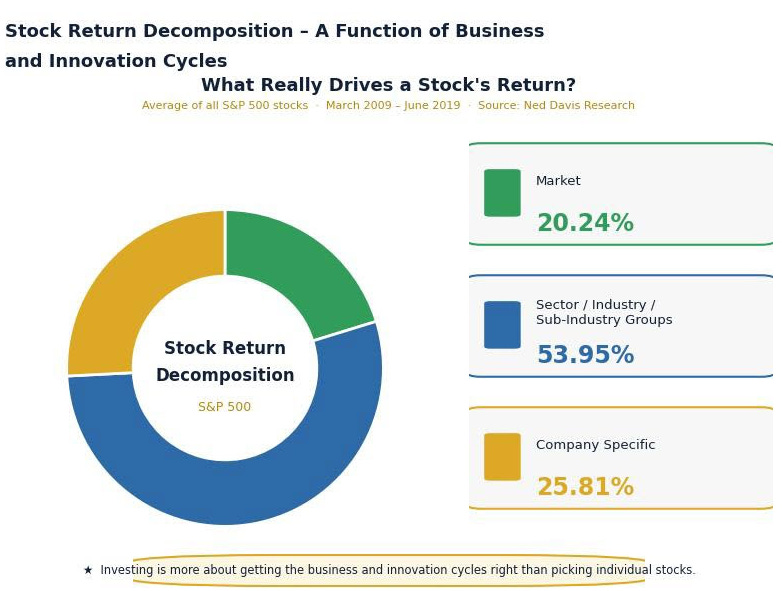
A stock’s performance depends far less on the specific company than we tend to think. Historically, more than half of returns have been explained by the sector, industry, or subsector to which a company belongs, compared with roughly 26% attributable to company-specific factors. In cyclical businesses, therefore, getting the sector positioning right is often even more important than finding the perfect operator.
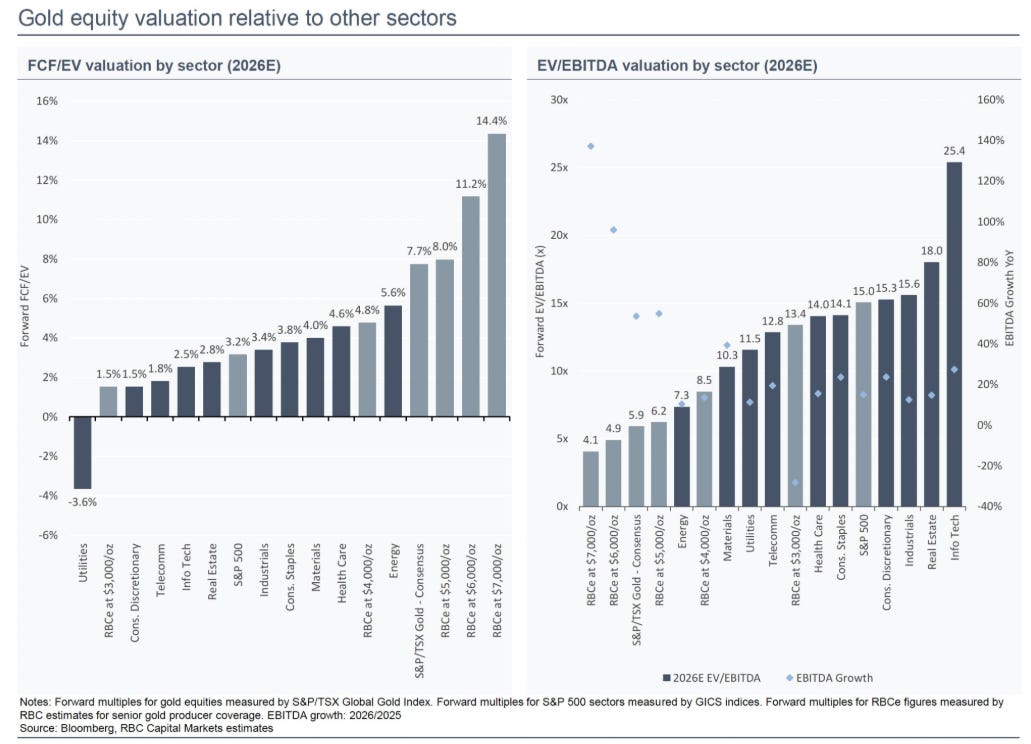
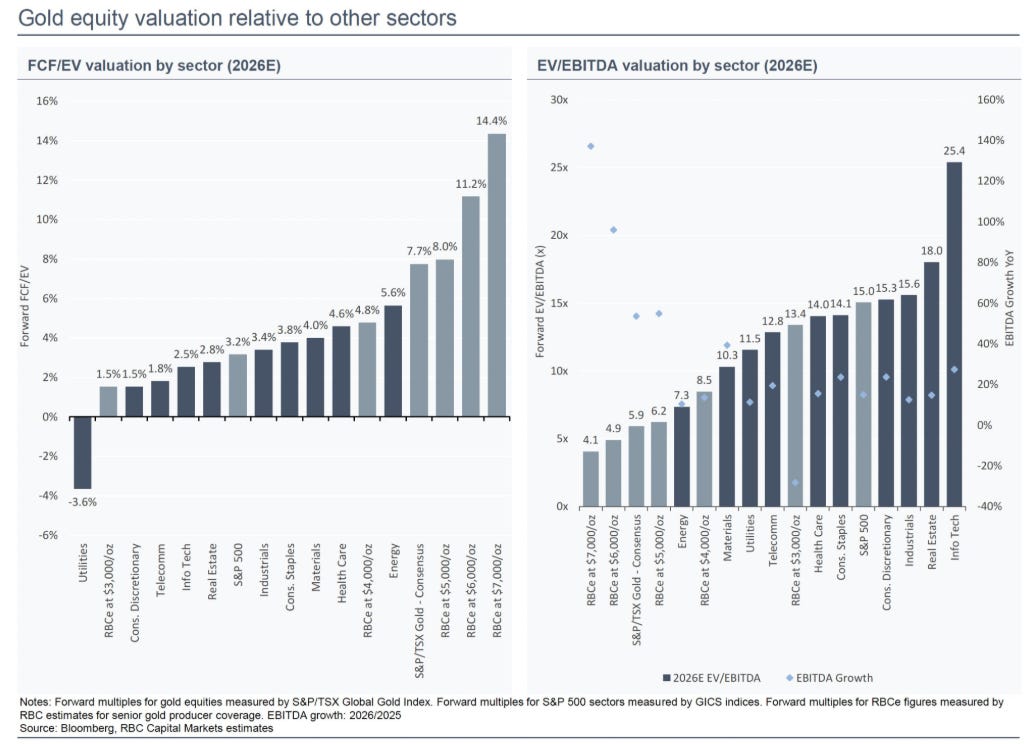
This is where gold miners start to look particularly attractive. Based on 2026 estimates, the sector offers a free cash flow yield of around 7.7% and trades at approximately 7.3x EV/EBITDA, below most sectors in the market. What makes this especially interesting is that this depressed valuation coexists with meaningful EBITDA growth, something that is difficult to reconcile with the sector’s current discount. The market continues to treat miners solely as low-quality, capital-intensive businesses—which they are—with a long history of poor capital allocation. To some extent, that mistrust is justified. For years, many companies destroyed value through acquisitions made at the top of the cycle, cost overruns, weak balance sheets, and constant shareholder dilution.
However, the sector is entering this phase with healthier financial structures, greater capital discipline, and, in many cases, a clear focus on returning cash to shareholders.
The optionality is also enormous. If gold continues to rise while costs remain relatively contained, a large part of every additional increase in the gold price flows directly into earnings and free cash flow. At $5,000 per ounce, the sector’s FCF yield would approach 8%; at $6,000 per ounce, it would exceed 11%; and at $7,000 per ounce, it would be close to 14%. The thesis does not require any of these scenarios to materialise, but they help illustrate the significant operating leverage embedded in the business. Of course, not all mining companies are created equal. Jurisdiction, asset life, ore grade, costs, balance-sheet strength, and capital discipline remain decisive factors.
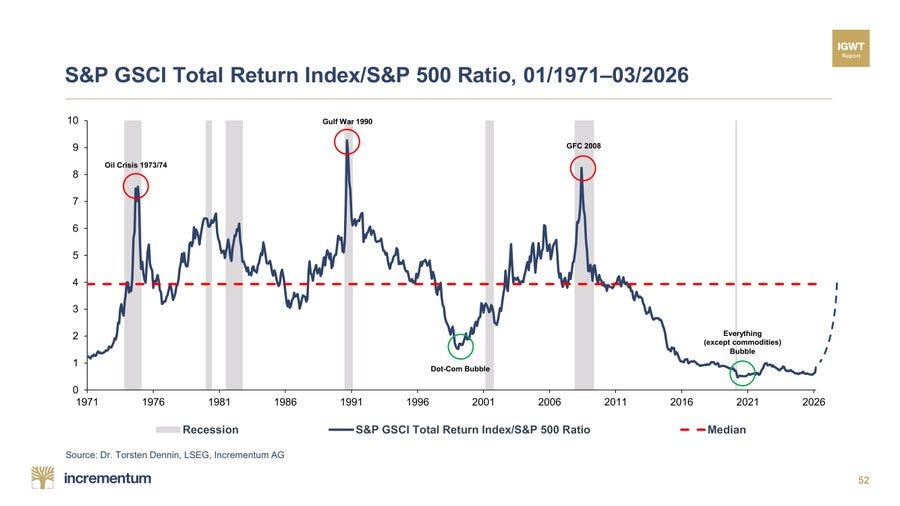
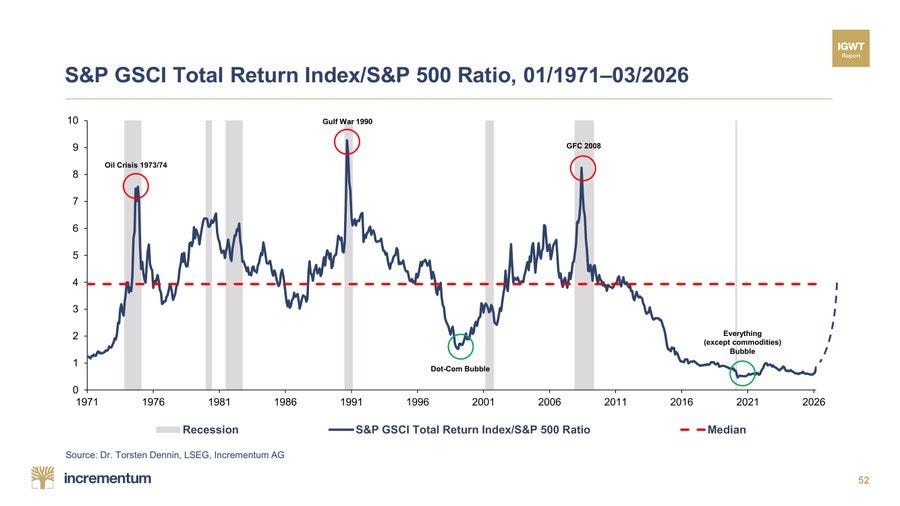
In fact, this is not an issue specific to gold miners, but one that applies to the entire commodities complex. Despite having rebounded strongly in relative terms from the 2020 lows, commodities remain at historically depressed levels. That becomes particularly intriguing and attractive in an era of US dollar debasement and record infrastructure investment.
The war between the United States and Iran has once again placed oil at the center of the geopolitical chessboard, yet the market’s reaction has been surprisingly restrained. Under almost any other circumstances, a combination of attacks on oil tankers in the Strait of Hormuz, production shutdowns across the Middle East, direct clashes between Washington and Tehran, and the disruption of one of the world’s most important energy arteries would have triggered a vertical surge in crude prices. Instead, Brent is hovering at around $85 per barrel, while WTI remains near the $80 range.
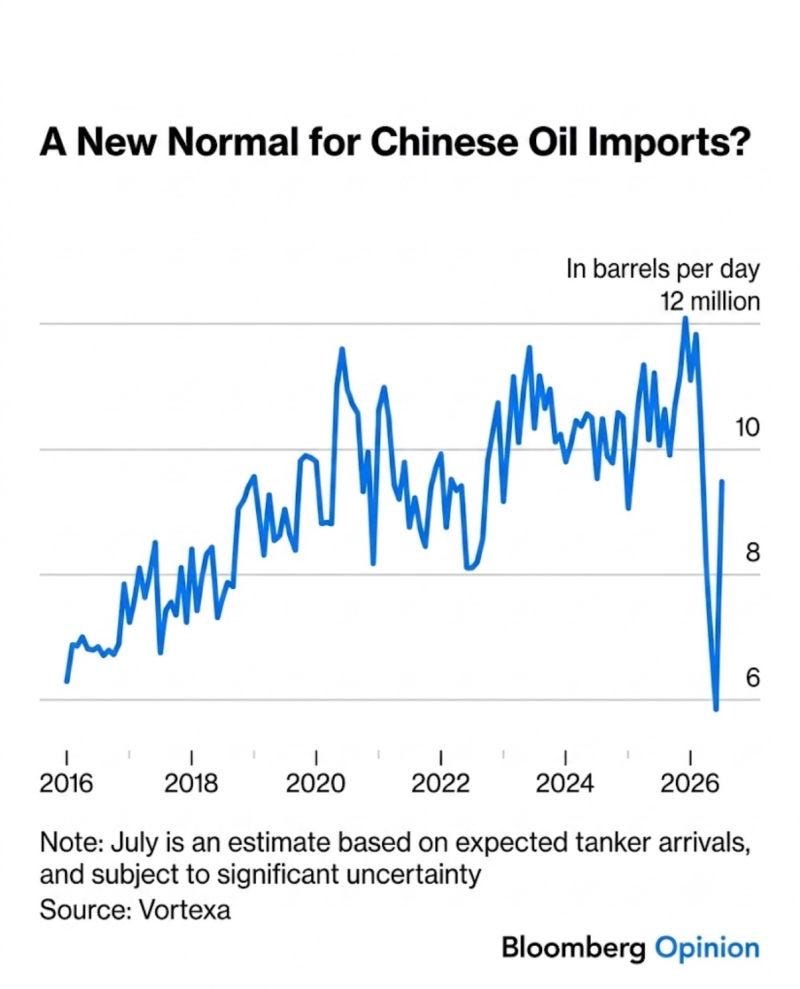
The physical situation is far more fragile than prices suggest. Global oil inventories are approximately 900 million barrels below their late-February levels, refined product stocks are so depleted that refining margins are trading at record highs, and U.S. commercial inventories are approaching minimum operational levels. China has also lifted restrictions on product exports and is beginning to absorb a significant portion of the available floating storage. In other words, there is no substantial buffer available to withstand a prolonged disruption.
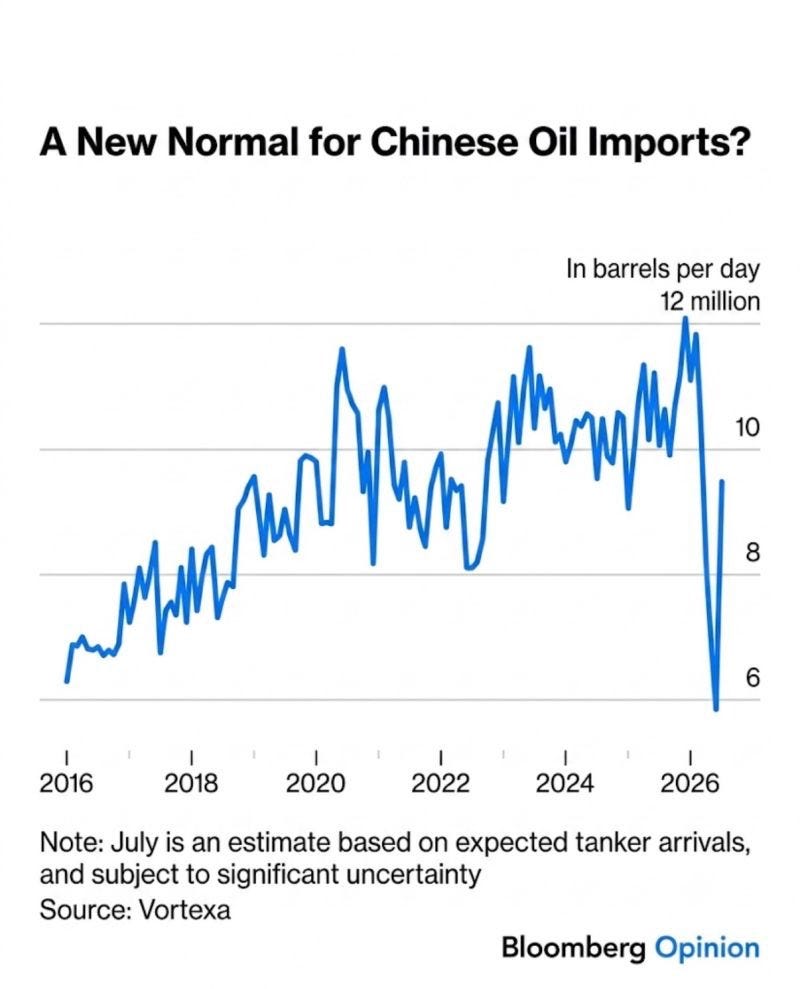
At the same time, shut-in production across the Middle East is once again approaching 7.5 million barrels per day and could rise towards 11 million if Fujairah is restricted and Oman’s maritime corridor becomes unusable. This risk is now being compounded by the Red Sea front. Iran has reportedly asked the Houthis to prepare to disrupt traffic through Bab el-Mandeb if the United States attacks its electricity infrastructure. The group is said to have already deployed drones and missiles near the strait, a route through which approximately 4 million barrels per day of crude oil and another 1 million barrels of refined products pass. The problem is not only the possibility of Bab el-Mandeb being closed, but that this threat is emerging while Hormuz is already blocked. The region therefore risks losing its two main energy export routes simultaneously. Saudi Arabia has redirected roughly 70% of its exports towards Yanbu, on the Red Sea, specifically to bypass the crisis in the Gulf. If the Houthis attack that infrastructure or resume targeting maritime traffic, the principal alternative route would also be compromised.
Iran’s strategy appears clear. Tehran is seeking to raise the economic cost of any further U.S. escalation and turn global energy supply into its primary source of leverage. It does not need to sink every vessel or physically close the straits for months. It only needs to increase the perceived risk, drive up insurance premiums, and force shipping companies and traders to avoid the region. In a market with inventories at minimal levels, every barrel that takes longer to arrive matters.
What is truly unusual, therefore, is not that the market is under pressure, but that prices have yet to reflect it. The most likely explanation is that investors continue to treat the conflict as a temporary disruption, relying on a rapid de-escalation or on the ability of other producers to replace the lost barrels. But that confidence rests on an increasingly fragile foundation. Effective spare capacity is limited, inventories have been drained, and alternative routes are also under threat. Oil does not need 11 million barrels per day to disappear for an extended period in order to rise. It only needs the market to stop believing that those barrels will return tomorrow. The current complacency can persist for as long as traders continue to view the conflict as a political episode. The moment they begin to see it as a physical supply problem, the adjustment could be extremely rapid. As always, the barrel will ultimately impose its own arithmetic.
Model Portfolio
Year to date, the model portfolio is up +17.8%, versus +12.56% for the S&P 500 (S&P in euros), and +203.7% since inception (September 2022), compared with +69.1% for the S&P 500. The model portfolio, as of Friday's close, is as follows:
⚠️Past performance does not guarantee future results. The historical performance of the model portfolio is shown for informational and educational purposes only and does not constitute investment advice or an offer to buy or sell securities. The returns shown may not include fees, taxes, or other associated costs.
