

Weekly summary 16/03
Weekly summary 16/03
Rematch for the White House

Disclaimer
LWS Financial Research is NOT a financial advisory service, nor is its author qualified to offer such services.
All content on this website and publications, as well as all communications from the author, are for educational and entertainment purposes only and under no circumstances, express or implied, should be considered financial, legal, or any other type of advice. Each individual should carry out their own analysis and make their own investment decisions.
This week we will have a lot of activity in the newsletter, with the publication of two articles:
New investment thesis, exploring the opportunity offered by the uranium sector and, specifically, the company Denison Mines, which we will publish tomorrow.
Update of the investment analysis of Peabody Energy and its valuation model, originally published in 2022, with all the information up to December 2023.
Weekly macro summary
There have also been quite a few interesting events to analyze, and below I list the most noteworthy news. Let's get started:
On Tuesday, both Donald Trump and Joe Biden confirmed enough delegates to secure their nomination as presidential candidates in their respective parties. This marks the first re-election campaign in the last 68 years, and all indications suggest that Trump has a clear advantage. As we mentioned in the first publication of this year, the November election in the United States is one of the main events of the year for the markets, and the outcome will bring new themes and interesting sectors to invest in.
The battle between the United States and China, which has been ongoing for years on all relevant fronts except the military, returns with force in the economic realm, with the approval by the US Congress of a ban on the TikTok app, owned by ByteDance, a Chinese company. The law provides a six-month period to arrange a sale of the asset or it will block the application in the country, and several investors, led by former Secretary Mnuchin, are already preparing their bids. In order to carry out the divestment, ByteDance would need permission from the government, which currently opposes it; there is also not full consensus within the Democratic Party itself, as they fear a negative reaction from the younger segment of the population, seeing it as a direct attack on their freedoms.
The inflation report for February surprised again to the upside. The price index increased by 0.44% MoM (+3.2% YoY), with housing and gasoline as the main contributors to the rise (this is beginning to cause concern, as energy will no longer compare negatively YoY from now on). The supercore data, one of the Fed's key benchmark indicators, experienced a significant month-on-month deceleration compared to January, which somewhat relieved the pressure and burden of this news.

The market seemed not to care much, and when the major indices have a positive reaction to such a report, it means that no one believes the Fed anymore, and they assume that they will have to backtrack on part of the restrictive path sooner rather than later, even if it means raising the long-term inflation target beyond 2%.

The following Markets in a Minute graph is very illustrative of the global inflationary situation, showing how, except for a few exceptions, both in Europe, America, and Asia, the numbers are already more than reasonable, which is why there are more central banks lowering rates than raising them.

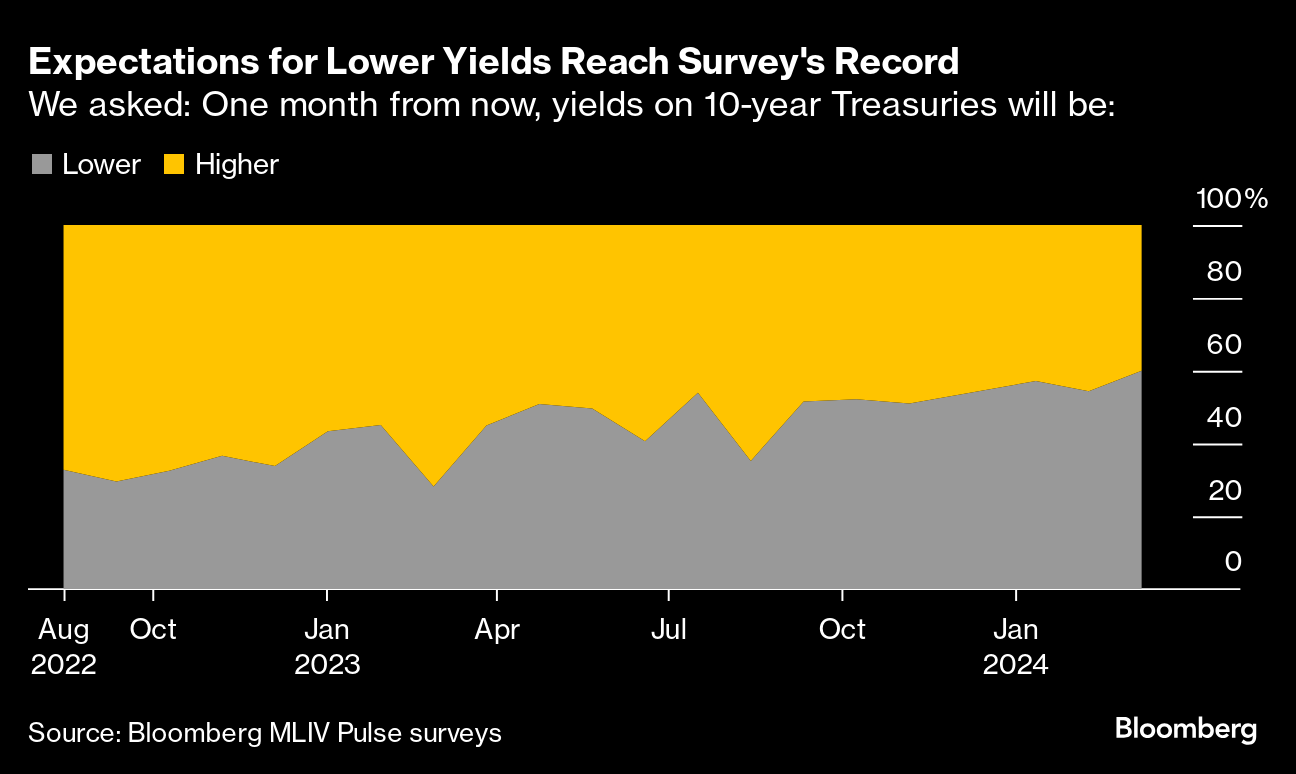
Despite this slightly higher-than-expected inflation data, the market is already pricing in the imminent rate cuts, understanding that the Fed is a political entity, and they envision June as the most likely time for the first cut.

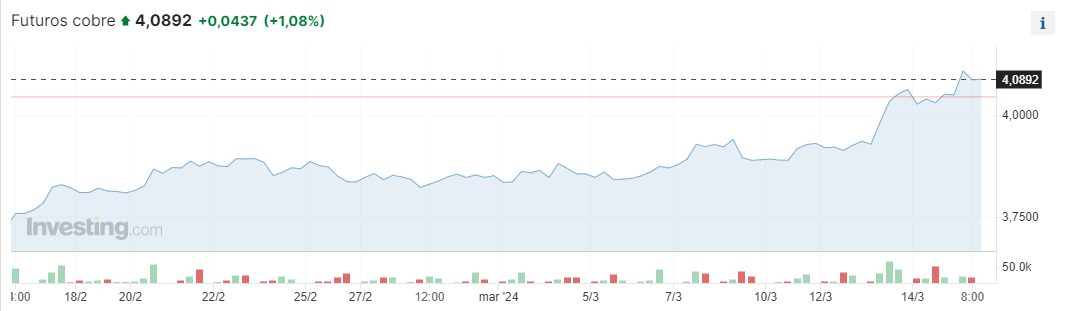
The price of copper reached its highest level in the past seven months on Wednesday, with a sharp increase, after a group of Chinese smelters announced coordinated production cuts to regain profitability in their operations. Copper tends to be a good financial indicator, and sentiment regarding economic recovery appears to be improving, which, combined with the already anticipated deficit following the negative supply surprise from Cobre Panama, bodes well for a very interesting outlook for the metal. We have made changes to the model portfolio to try to capitalize on this trend.

The week in the Bitcoin market has been filled with volatility and news, including a notable correction on Thursday, with an intraday drop of ~10%. The demand shock is coming from several fronts at once, and it seems to be accelerating, with ETFs receiving $500M-$1B per day, Microstrategy raising $1.3B in debt to buy more Bitcoin, large funds like Patient Capital Management ($1.4B AUM, 15% allocation) or Cetera Group ($475B AUM), and other major unknown players, such as a mysterious South Korean buyer who has been purchasing Bitcoin in increments of 100 units several times a day since late 2022 (on Thursday, for example, they acquired 900 BTC, which is all the new daily supply generated). In fact, JPM noted that Bitcoin has outperformed gold, adjusted for volatility, in institutional portfolios' allocation.

The natural question in this context is: who is selling? We can observe how the downward pressure focuses on retail users (0-10BTC), generally less informed and with lower tolerance for volatility, and on miners, who are preparing for the halving by creating a safety cushion. Their outlook may change and darken if Biden's government proposal to create an extraordinary 30% tax on the electricity they consume is approved, making these operations unfeasible in the North American country.

As we have been pointing out for weeks, the daily demand from ETFs exceeds daily supply by an order of magnitude, and the problem will become more pronounced in 30 days, with the halving reducing mining rewards by half. In this context, it is interesting to remember the finite nature of the asset and the inelasticity of supply to respond to price stimulus, and to understand that, of the 21 million Bitcoins that will exist, 23% are already out of circulation forever, and another 6.5% has not yet been issued. Tick tock.

It seems that, following the debacle of November, thanks to a firmer-than-expected demand, OPEC+ has partially regained control of the market. We have had another good inventory data from the EIA: -1.536Mb of crude, -0.22Mb in Cushing, -5.66Mb of gasoline, and +0.88Mb of distillates. In 2024, crude inventories have increased by 16Mb and refined inventories have fallen by 40.6Mb, making the balance much more bullish than initially forecasted.
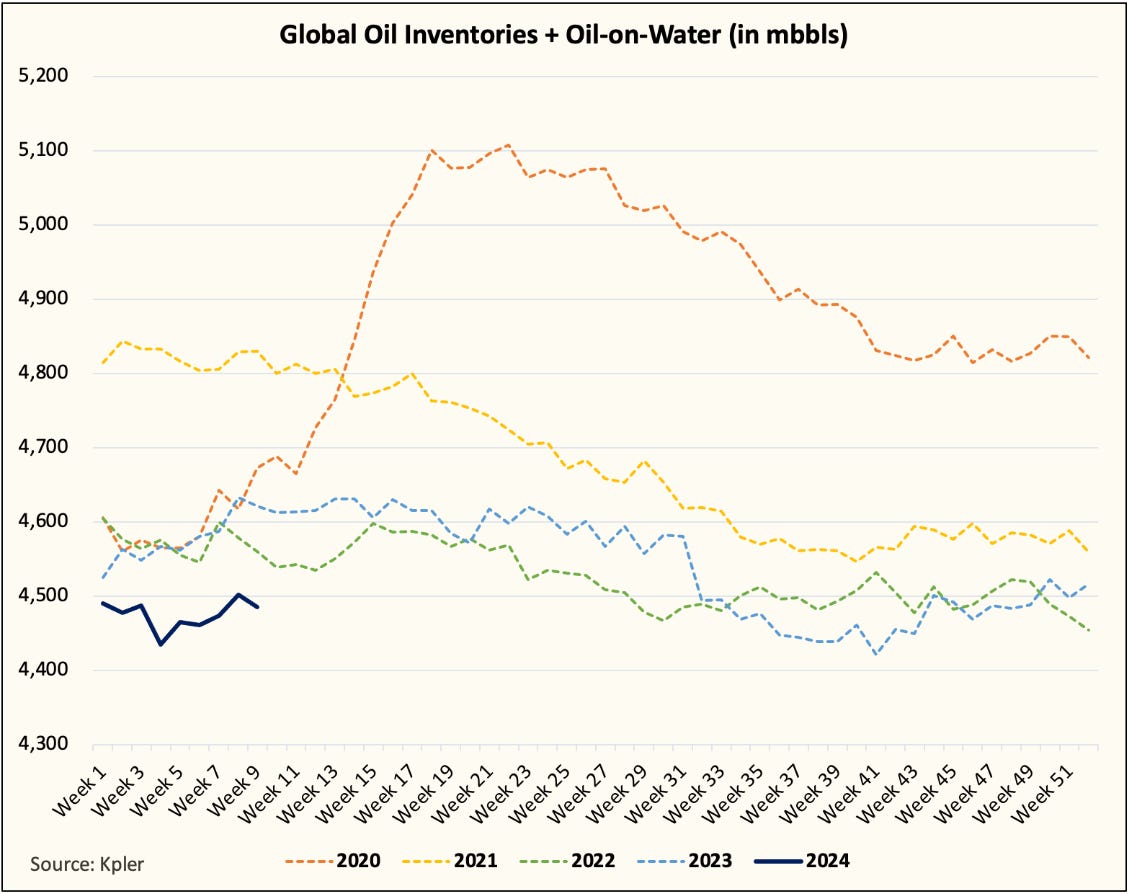
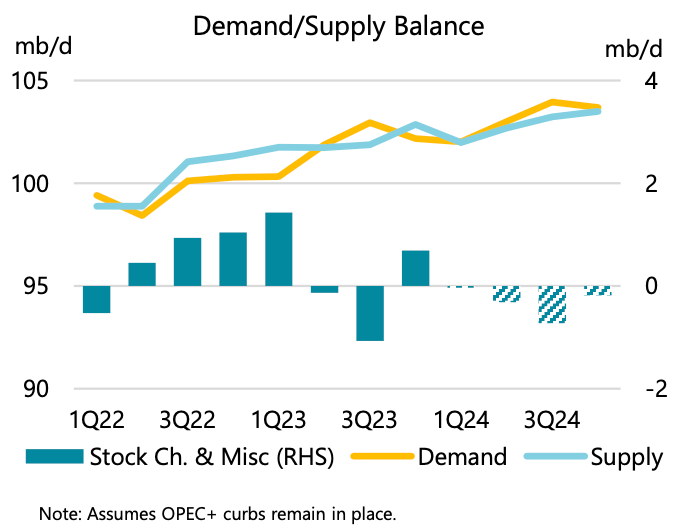
The most interesting aspect is that this tightening has occurred without a significant cut from OPEC+, where only Saudi Arabia seems to be sticking to its promises (this, in turn, makes such a cut more sustainable, returning market control to KSA). In fact, reality can no longer be ignored, and the EIA has been forced to change its market balance forecasts, as the previous version did not align with the inventory movement: where they previously saw a comfortable surplus, with downward pressure on prices, they now forecast a deficit.

These forecasts have a significant direct influence on crude oil prices, which are now expected to average $87/b in 2024 and $85/b in 2025.
We expect that the tighter oil market balance during 2024 will keep the Brent price above current levels, averaging $88/b in 2Q24, $4/b higher than in last month’s STEO. We expect it will remain relatively flat for the rest of the year before increasing inventories (when OPEC+ supply cuts are set to expire) start putting slight downward pressure on the price in 2025. We forecast that the Brent crude oil price will decrease from an average of $88/b in January 2025 to an average of $82/b in December 2025, averaging $87/b in 2024 and $85/b in 2025.


Model Portfolio
Nature is healing. The current environment of high interest rates and restrictive monetary policy, in addition to combating inflation by suppressing demand, has raised the cost of capital for many projects. Their meager returns only allow them to thrive in artificial credit environments with 0% (or negative, in some cases) interest rates and substantial subsidies.
One of the themes that best illustrates this situation is the ESG narrative (renewable energy, circular economy...), where political pressure and support (subsidies, prohibition of alternatives, mandatory usage...) and banking and fund marketing initiated many projects that are now proving economically unviable and inferior. The narrative claimed that investment returns associated with this category would be superior (no need to sacrifice profitability, while promoting progress and the common good). Now, the experiment has failed.Investor interest, once it became clear that the narrative and returns were not aligned, has vanished, and capital flows have stopped reaching these vehicles. Interest rates, much like high commodity prices, regulate superfluous and marginal uses of credit and capital, eliminating financing for the weakest links in the returns pyramid initially. In my opinion, over time, when we analyze these trends, they will be identified as the greatest exercise of economic waste in history.
The model portfolio return is +4.82% YTD vs +7.15% for the S&P500 and +41% vs +28.53% for the S&P500 since inception (September 2022).
Keep reading with a 7-day free trial
Subscribe to LWS Financial Research to keep reading this post and get 7 days of free access to the full post archives.